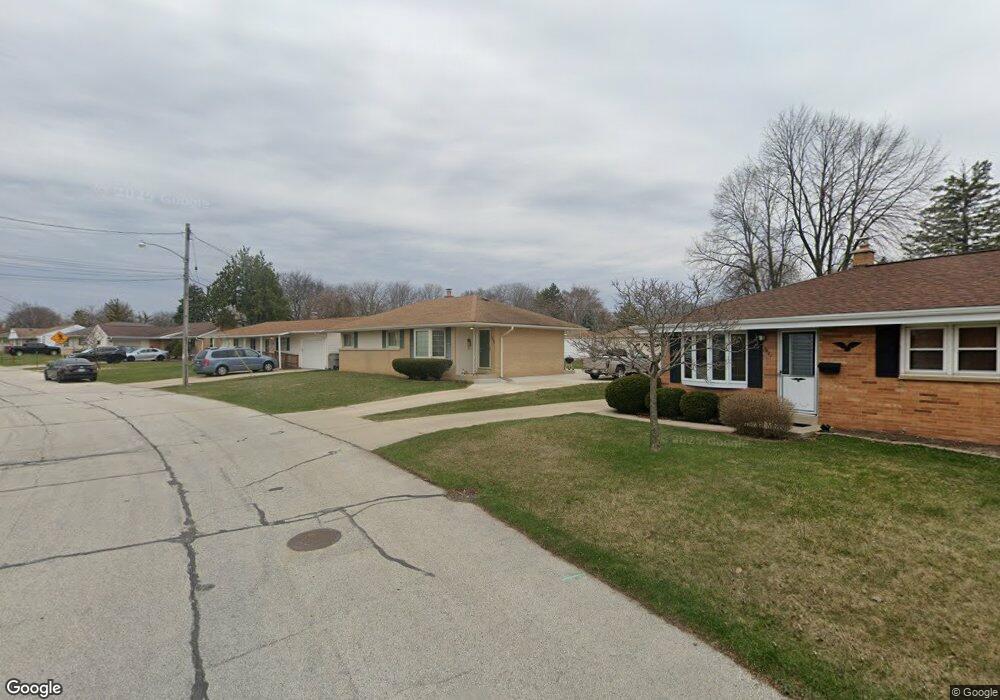
3695 S 69th St Milwaukee, WI 53220
Wedgewood NeighborhoodEstimated Value: $261,873 - $294,000
3
Beds
1
Bath
1,011
Sq Ft
$277/Sq Ft
Est. Value
About This Home
This home is located at 3695 S 69th St, Milwaukee, WI 53220 and is currently estimated at $279,968, approximately $276 per square foot. 3695 S 69th St is a home located in Milwaukee County with nearby schools including Milwaukee Spanish Immersion School - Upper Campus, Craig Montessori School, and La Escuela Fratney.
Ownership History
Date
Name
Owned For
Owner Type
Purchase Details
Closed on
Nov 12, 2009
Sold by
Lanza Nancy J
Bought by
Quigley Richard D and Quigley Alana
Current Estimated Value
Home Financials for this Owner
Home Financials are based on the most recent Mortgage that was taken out on this home.
Original Mortgage
$153,225
Outstanding Balance
$100,152
Interest Rate
5.02%
Mortgage Type
VA
Estimated Equity
$179,816
Purchase Details
Closed on
Aug 31, 2007
Sold by
Lanza Barbara E and Manville Waite J
Bought by
Lanza Nancy J
Purchase Details
Closed on
Mar 23, 2007
Sold by
Lanza Nancy J
Bought by
Lanza Barbara E and Manville Waite J
Home Financials for this Owner
Home Financials are based on the most recent Mortgage that was taken out on this home.
Original Mortgage
$149,200
Interest Rate
4.25%
Mortgage Type
Seller Take Back
Purchase Details
Closed on
Feb 22, 2006
Sold by
Fiedorczyk Sigmund J
Bought by
Lanza Nancy
Create a Home Valuation Report for This Property
The Home Valuation Report is an in-depth analysis detailing your home's value as well as a comparison with similar homes in the area
Home Values in the Area
Average Home Value in this Area
Purchase History
| Date | Buyer | Sale Price | Title Company |
|---|---|---|---|
| Quigley Richard D | $150,000 | None Available | |
| Lanza Nancy J | -- | None Available | |
| Lanza Barbara E | $150,000 | None Available | |
| Lanza Nancy | $157,200 | Gatewood Title Services |
Source: Public Records
Mortgage History
| Date | Status | Borrower | Loan Amount |
|---|---|---|---|
| Open | Quigley Richard D | $153,225 | |
| Previous Owner | Lanza Barbara E | $149,200 |
Source: Public Records
Tax History Compared to Growth
Tax History
| Year | Tax Paid | Tax Assessment Tax Assessment Total Assessment is a certain percentage of the fair market value that is determined by local assessors to be the total taxable value of land and additions on the property. | Land | Improvement |
|---|---|---|---|---|
| 2024 | $4,204 | $199,400 | $42,500 | $156,900 |
| 2023 | $4,064 | $172,000 | $42,500 | $129,500 |
| 2022 | $3,780 | $172,000 | $42,500 | $129,500 |
| 2021 | $3,891 | $160,100 | $42,400 | $117,700 |
| 2020 | $3,931 | $160,100 | $42,400 | $117,700 |
| 2019 | $3,463 | $139,600 | $41,500 | $98,100 |
| 2018 | $3,382 | $139,600 | $41,500 | $98,100 |
| 2017 | $3,460 | $134,200 | $43,700 | $90,500 |
| 2016 | $3,356 | $124,500 | $43,700 | $80,800 |
| 2015 | $3,337 | $120,900 | $43,700 | $77,200 |
| 2014 | $3,407 | $120,900 | $43,700 | $77,200 |
| 2013 | -- | $120,900 | $43,700 | $77,200 |
Source: Public Records
Map
Nearby Homes
- 3700 S Massachusetts Ave
- 6818 W Morgan Ave
- 3812 S 74th St
- 6507 W Dodge Place Unit 6507
- 6512 W Dodge Place Unit 10
- 6614 W Morgan Ave
- 3558 S 75th St
- 3471 S 66th St
- 3514 S Massachusetts Ave
- 6420 W Dodge Place Unit 22
- 3984 S 72nd St
- 3331 S 69th St
- 3366 S 65th St
- 7429 W Ohio Ave
- 6151 W Howard Ave Unit C32
- 6611 W Burdick Ave
- 3301 S 76th St
- 8101 W Tripoli Ave Unit 8103
- 3171 S 76th St
- 3155 S 76th St
- 3699 S 69th St
- 3687 S 69th St
- 3679 S 69th St
- 3666 S Sunset Dr
- 3686 S 69th St
- 3705 S 69th St
- 3644 S Sunset Dr
- 3698 S 69th St
- 3667 S Sunset Dr
- 3658 S Sunset Dr
- 3671 S 69th St
- 3638 S Sunset Dr
- 3670 S 69th St
- 3704 S 69th St
- 3639 S Sunset Dr
- 3717 S 69th St
- 3647 S Honey Creek Dr
- 3635 S Honey Creek Dr
- 3714 S 69th St
- 3704 S Sunset Dr