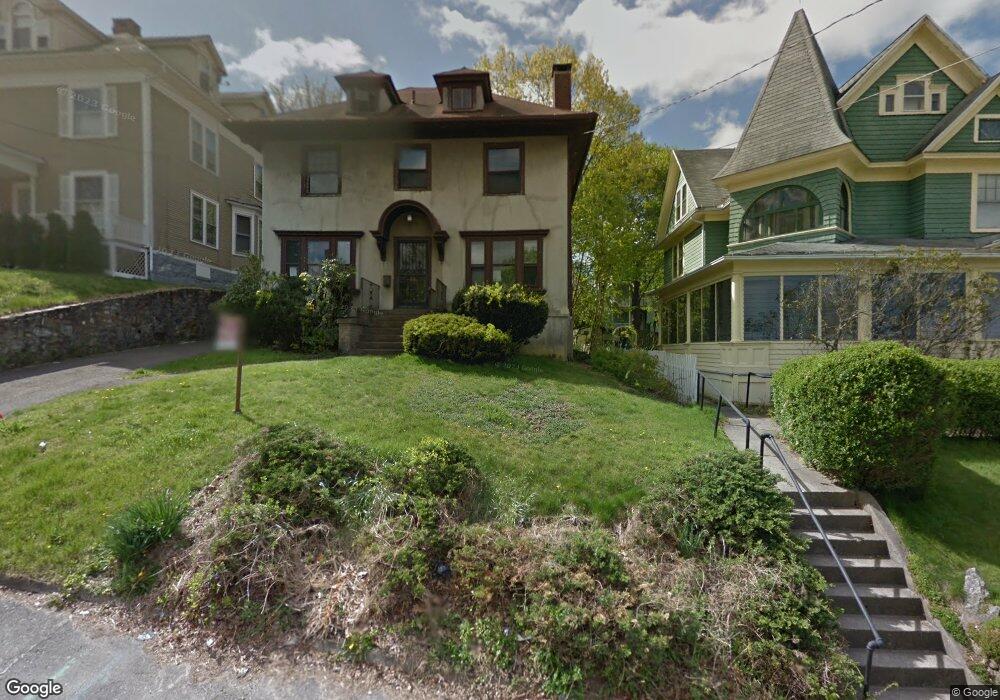
37 Chapman Ave Waterbury, CT 06710
Village of Waterbury NeighborhoodEstimated Value: $196,000 - $278,000
3
Beds
2
Baths
1,716
Sq Ft
$140/Sq Ft
Est. Value
About This Home
This home is located at 37 Chapman Ave, Waterbury, CT 06710 and is currently estimated at $240,566, approximately $140 per square foot. 37 Chapman Ave is a home located in New Haven County with nearby schools including F. J. Kingsbury School, North End Middle School, and Wilby High School.
Ownership History
Date
Name
Owned For
Owner Type
Purchase Details
Closed on
Sep 29, 2023
Sold by
Petreyko Paul G
Bought by
Schwartz Isaac
Current Estimated Value
Home Financials for this Owner
Home Financials are based on the most recent Mortgage that was taken out on this home.
Original Mortgage
$120,000
Outstanding Balance
$117,689
Interest Rate
7.23%
Mortgage Type
Purchase Money Mortgage
Estimated Equity
$122,877
Purchase Details
Closed on
Dec 14, 2011
Sold by
Rosario Daisy
Bought by
Petreyko Paul G
Purchase Details
Closed on
Jun 3, 2011
Sold by
Citimortgage Inc
Bought by
Department Of Housing & Urban Dev
Create a Home Valuation Report for This Property
The Home Valuation Report is an in-depth analysis detailing your home's value as well as a comparison with similar homes in the area
Home Values in the Area
Average Home Value in this Area
Purchase History
| Date | Buyer | Sale Price | Title Company |
|---|---|---|---|
| Schwartz Isaac | $160,000 | None Available | |
| Petreyko Paul G | -- | -- | |
| Department Of Housing & Urban Dev | -- | -- |
Source: Public Records
Mortgage History
| Date | Status | Borrower | Loan Amount |
|---|---|---|---|
| Open | Schwartz Isaac | $120,000 | |
| Previous Owner | Department Of Housing & Urban Dev | $63,000 | |
| Previous Owner | Department Of Housing & Urban Dev | $32,000 | |
| Previous Owner | Department Of Housing & Urban Dev | $7,887 |
Source: Public Records
Tax History Compared to Growth
Tax History
| Year | Tax Paid | Tax Assessment Tax Assessment Total Assessment is a certain percentage of the fair market value that is determined by local assessors to be the total taxable value of land and additions on the property. | Land | Improvement |
|---|---|---|---|---|
| 2025 | $5,573 | $123,900 | $24,010 | $99,890 |
| 2024 | $6,126 | $123,900 | $24,010 | $99,890 |
| 2023 | $6,714 | $123,900 | $24,010 | $99,890 |
| 2022 | $4,557 | $75,690 | $24,040 | $51,650 |
| 2021 | $4,557 | $75,690 | $24,040 | $51,650 |
| 2020 | $4,557 | $75,690 | $24,040 | $51,650 |
| 2019 | $4,557 | $75,690 | $24,040 | $51,650 |
| 2018 | $4,557 | $75,690 | $24,040 | $51,650 |
| 2017 | $4,087 | $67,880 | $24,040 | $43,840 |
| 2016 | $4,087 | $67,880 | $24,040 | $43,840 |
| 2015 | $3,952 | $67,880 | $24,040 | $43,840 |
| 2014 | $3,952 | $67,880 | $24,040 | $43,840 |
Source: Public Records
Map
Nearby Homes
- 81 Clowes Terrace
- 152 Lincoln St Unit 19
- 37 Plaza Ave
- 271 Willow St
- 65 Cables Ave Unit 21
- 26 Ridgewood St
- 57 Ridgewood St
- 42 Concord St
- 60 Clifton Ave
- 95 Clinton St
- 184 Buckingham St
- 232 Hillside Ave
- 181 Buckingham St
- 651 Cooke St
- 38 Kellogg St
- 133 Willow St
- 50 Chestnut Ave
- 44 Bunker Hill Ave
- 338 Pine St
- 19 Collins St