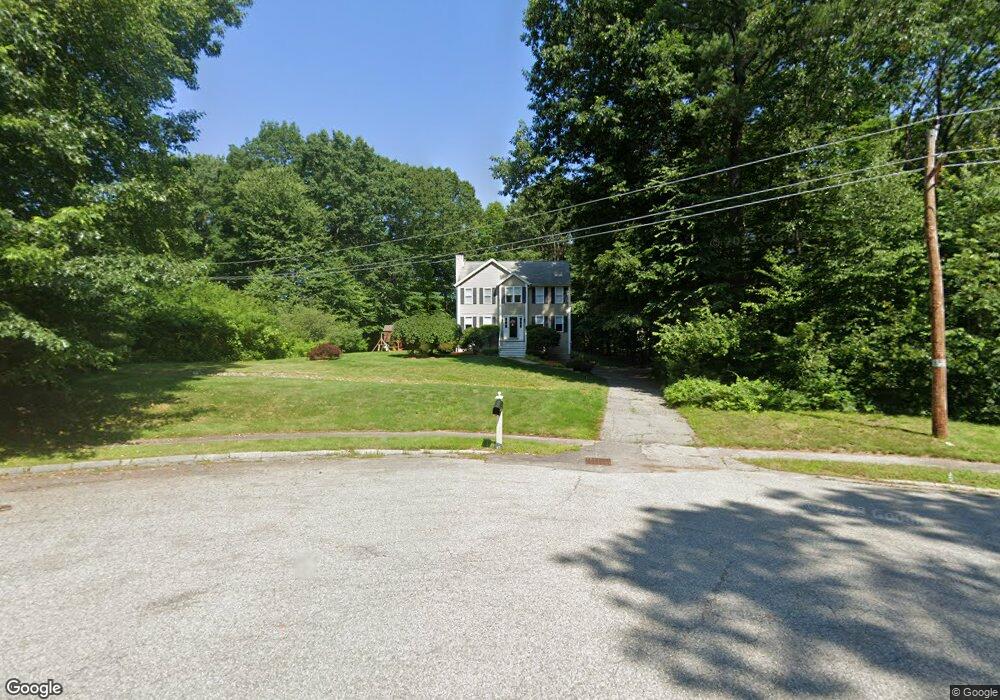
37 Hammond Farm Rd Haverhill, MA 01832
Ayer Village NeighborhoodEstimated Value: $682,307 - $729,000
3
Beds
2
Baths
1,910
Sq Ft
$371/Sq Ft
Est. Value
About This Home
This home is located at 37 Hammond Farm Rd, Haverhill, MA 01832 and is currently estimated at $708,577, approximately $370 per square foot. 37 Hammond Farm Rd is a home located in Essex County with nearby schools including Tilton Elementary School, Haverhill High School, and Hilltop School.
Ownership History
Date
Name
Owned For
Owner Type
Purchase Details
Closed on
Aug 21, 2006
Sold by
Couillard Karen and Buscanera Vincent R
Bought by
Couillard Karen M
Current Estimated Value
Home Financials for this Owner
Home Financials are based on the most recent Mortgage that was taken out on this home.
Original Mortgage
$165,000
Interest Rate
6.88%
Mortgage Type
Purchase Money Mortgage
Purchase Details
Closed on
Oct 5, 2004
Sold by
Buscanera Vincent R
Bought by
Buscanera Vincent R
Home Financials for this Owner
Home Financials are based on the most recent Mortgage that was taken out on this home.
Original Mortgage
$130,000
Interest Rate
5.81%
Mortgage Type
Purchase Money Mortgage
Purchase Details
Closed on
Oct 31, 1997
Sold by
Wendell Estates Rt
Bought by
Buscanera Vincent R
Create a Home Valuation Report for This Property
The Home Valuation Report is an in-depth analysis detailing your home's value as well as a comparison with similar homes in the area
Home Values in the Area
Average Home Value in this Area
Purchase History
| Date | Buyer | Sale Price | Title Company |
|---|---|---|---|
| Couillard Karen M | -- | -- | |
| Buscanera Vincent R | -- | -- | |
| Buscanera Vincent R | $60,000 | -- |
Source: Public Records
Mortgage History
| Date | Status | Borrower | Loan Amount |
|---|---|---|---|
| Open | Buscanera Vincent R | $161,000 | |
| Closed | Buscanera Vincent R | $165,000 | |
| Previous Owner | Buscanera Vincent R | $130,000 | |
| Previous Owner | Buscanera Vincent R | $15,000 |
Source: Public Records
Tax History Compared to Growth
Tax History
| Year | Tax Paid | Tax Assessment Tax Assessment Total Assessment is a certain percentage of the fair market value that is determined by local assessors to be the total taxable value of land and additions on the property. | Land | Improvement |
|---|---|---|---|---|
| 2025 | $6,060 | $565,800 | $222,100 | $343,700 |
| 2024 | $5,734 | $538,900 | $209,500 | $329,400 |
| 2023 | $5,688 | $510,100 | $209,500 | $300,600 |
| 2022 | $5,481 | $430,900 | $188,300 | $242,600 |
| 2021 | $5,380 | $400,300 | $177,700 | $222,600 |
| 2020 | $5,191 | $381,700 | $165,000 | $216,700 |
| 2019 | $5,208 | $373,300 | $156,600 | $216,700 |
| 2018 | $5,002 | $350,800 | $148,100 | $202,700 |
| 2017 | $4,890 | $326,200 | $135,400 | $190,800 |
| 2016 | $4,656 | $303,100 | $116,400 | $186,700 |
| 2015 | $4,653 | $303,100 | $116,400 | $186,700 |
Source: Public Records
Map
Nearby Homes
- 28 Emma Rose Cir Unit Lot 2
- 17 Sawmill Ridge Rd
- 47 Bailey Ct
- 1513 Broadway
- 74 Ayers Village Rd
- 48 Coolidge Ave
- 3 Lucy Way
- 450 Lake St
- 458 Lake St
- 186 Mohawk Trail
- 43 W Parish Ct Unit 30-A
- 33 Lake St
- 1 W Parish Ct
- 16 W Parish Ct
- 51 Front Nine Dr
- 12 Perkins Ct Unit 12
- 2 Danforth Ct
- 1 Ballard Ln
- 132 W Meadow Rd Unit 18
- 39 Clement Ct Unit 58A
- 30 Hammond Farm Rd
- 35 Hammond Farm Rd
- 31 Hammond Farm Rd
- 28 Hammond Farm Rd
- 27 Hammond Farm Rd
- 23 Hammond Farm Rd
- 24 Hammond Farm Rd
- 19 Hammond Farm Rd
- 20 Hammond Farm Rd
- 1195 Broadway
- 1 Masys Way
- 21 Ruth Cir
- 16 Hammond Farm Rd
- 18 Ruth Cir
- 1189 Broadway
- 12 Hammond Farm Rd
- 17 Ruth Cir
- 14 Ruth Cir
- 1211 Broadway
- 8 Hammond Farm Rd