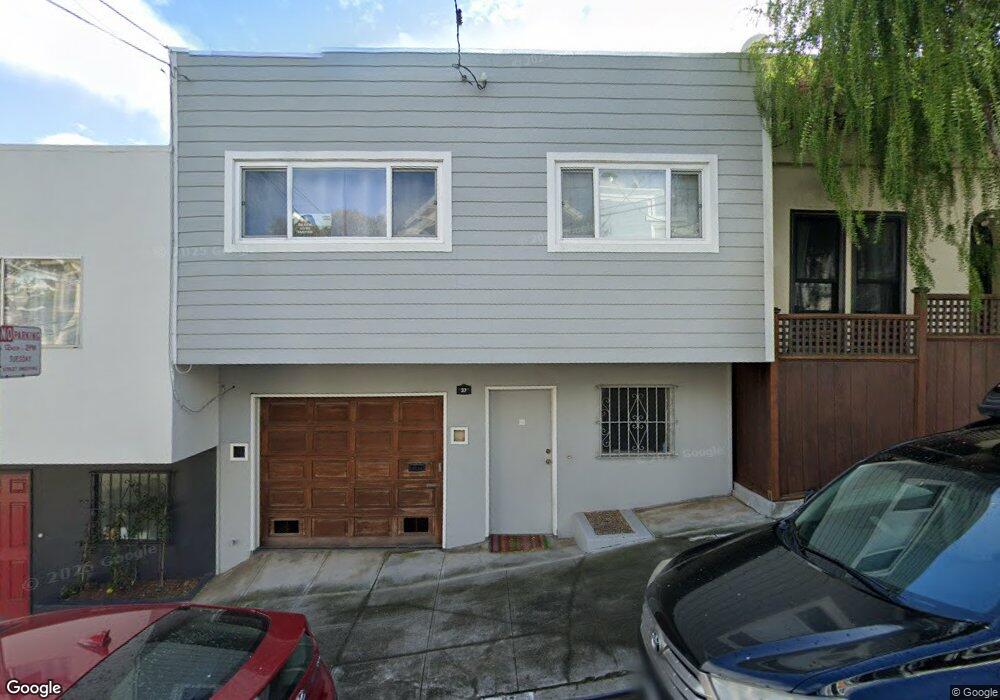
37 Putnam St San Francisco, CA 94110
Bernal Heights NeighborhoodEstimated Value: $1,100,000 - $1,322,051
2
Beds
1
Bath
1,198
Sq Ft
$993/Sq Ft
Est. Value
About This Home
This home is located at 37 Putnam St, San Francisco, CA 94110 and is currently estimated at $1,189,513, approximately $992 per square foot. 37 Putnam St is a home located in San Francisco County with nearby schools including Leonard R. Flynn Elementary, James Lick Middle School, and Donum Dei Classical Academy.
Ownership History
Date
Name
Owned For
Owner Type
Purchase Details
Closed on
Jan 15, 2020
Sold by
Gong Joseph and Gong Betty
Bought by
Lim Jimmy L and Lim Suyin G
Current Estimated Value
Purchase Details
Closed on
Dec 4, 2019
Sold by
Gong Joseph and Kui Hing Lau Gong 2000 Trust
Bought by
Gong Joseph and Gong Betty
Purchase Details
Closed on
Oct 29, 2018
Sold by
Gong Shee Chung
Bought by
Gong Joseph
Purchase Details
Closed on
Mar 3, 2000
Sold by
Lau Kui Hing
Bought by
Lau Kui Hing
Create a Home Valuation Report for This Property
The Home Valuation Report is an in-depth analysis detailing your home's value as well as a comparison with similar homes in the area
Home Values in the Area
Average Home Value in this Area
Purchase History
| Date | Buyer | Sale Price | Title Company |
|---|---|---|---|
| Lim Jimmy L | $500,000 | Fidelity National Title Co | |
| Gong Joseph | -- | Amrock | |
| Gong Joseph | -- | None Available | |
| Lau Kui Hing | -- | None Available |
Source: Public Records
Tax History Compared to Growth
Tax History
| Year | Tax Paid | Tax Assessment Tax Assessment Total Assessment is a certain percentage of the fair market value that is determined by local assessors to be the total taxable value of land and additions on the property. | Land | Improvement |
|---|---|---|---|---|
| 2025 | $10,596 | $853,904 | $417,481 | $436,423 |
| 2024 | $10,596 | $837,163 | $409,296 | $427,867 |
| 2023 | $10,432 | $820,751 | $401,272 | $419,479 |
| 2022 | $10,225 | $804,660 | $393,405 | $411,255 |
| 2021 | $10,042 | $788,884 | $385,692 | $403,192 |
| 2020 | $1,478 | $61,592 | $13,476 | $48,116 |
| 2019 | $1,434 | $60,419 | $13,226 | $47,193 |
| 2018 | $1,306 | $59,204 | $12,954 | $46,250 |
| 2017 | $990 | $58,044 | $12,700 | $45,344 |
| 2016 | $941 | $56,908 | $12,452 | $44,456 |
| 2015 | $925 | $56,056 | $12,266 | $43,790 |
| 2014 | $901 | $54,960 | $12,026 | $42,934 |
Source: Public Records
Map
Nearby Homes