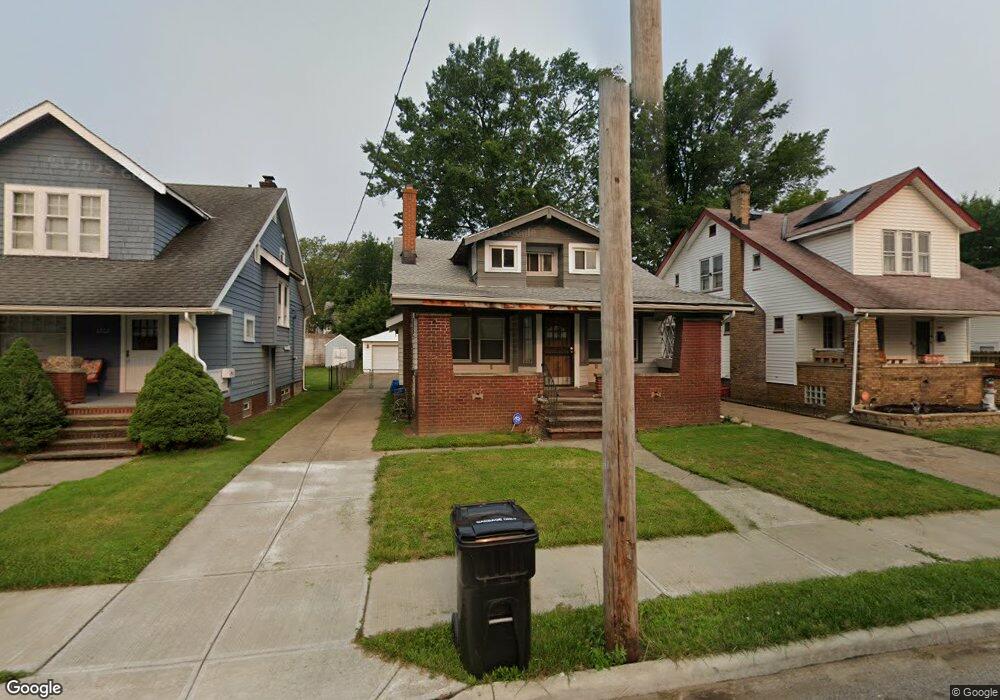
3700 W 130th St Cleveland, OH 44111
Jefferson NeighborhoodEstimated Value: $154,651 - $191,000
4
Beds
3
Baths
1,703
Sq Ft
$97/Sq Ft
Est. Value
About This Home
This home is located at 3700 W 130th St, Cleveland, OH 44111 and is currently estimated at $165,913, approximately $97 per square foot. 3700 W 130th St is a home located in Cuyahoga County with nearby schools including Artemus Ward School, Almira Academy, and Benjamin Franklin.
Ownership History
Date
Name
Owned For
Owner Type
Purchase Details
Closed on
Jun 14, 1994
Sold by
Rynties Gregory C
Bought by
Raybon Renfro L and Raybon Sandra L
Current Estimated Value
Home Financials for this Owner
Home Financials are based on the most recent Mortgage that was taken out on this home.
Original Mortgage
$66,500
Interest Rate
8.45%
Mortgage Type
New Conventional
Purchase Details
Closed on
Jan 21, 1993
Bought by
Rynties Gregory
Purchase Details
Closed on
Sep 20, 1991
Sold by
Burlingham Robert L and Burlingham Linda
Bought by
Federal National Mortgage
Purchase Details
Closed on
Jun 30, 1983
Sold by
Bouhall John A
Bought by
Burlingham Robert L and Burlingham Linda
Purchase Details
Closed on
Nov 20, 1980
Sold by
Goddard Jeff D and Goddard Grace
Bought by
Bouhall John A
Purchase Details
Closed on
Jan 1, 1975
Bought by
Goddard Jeff D and Goddard Grace
Create a Home Valuation Report for This Property
The Home Valuation Report is an in-depth analysis detailing your home's value as well as a comparison with similar homes in the area
Home Values in the Area
Average Home Value in this Area
Purchase History
| Date | Buyer | Sale Price | Title Company |
|---|---|---|---|
| Raybon Renfro L | $70,000 | -- | |
| Rynties Gregory | $37,000 | -- | |
| Federal National Mortgage | $30,000 | -- | |
| Burlingham Robert L | $44,000 | -- | |
| Bouhall John A | $28,000 | -- | |
| Goddard Jeff D | -- | -- |
Source: Public Records
Mortgage History
| Date | Status | Borrower | Loan Amount |
|---|---|---|---|
| Closed | Raybon Renfro L | $66,500 |
Source: Public Records
Tax History Compared to Growth
Tax History
| Year | Tax Paid | Tax Assessment Tax Assessment Total Assessment is a certain percentage of the fair market value that is determined by local assessors to be the total taxable value of land and additions on the property. | Land | Improvement |
|---|---|---|---|---|
| 2024 | $2,295 | $44,800 | $8,435 | $36,365 |
| 2023 | $2,805 | $38,260 | $6,860 | $31,400 |
| 2022 | $2,748 | $38,260 | $6,860 | $31,400 |
| 2021 | $2,203 | $38,260 | $6,860 | $31,400 |
| 2020 | $1,805 | $29,650 | $5,320 | $24,330 |
| 2019 | $1,669 | $84,700 | $15,200 | $69,500 |
| 2018 | $1,663 | $29,650 | $5,320 | $24,330 |
| 2017 | $1,949 | $23,630 | $4,130 | $19,500 |
| 2016 | $1,934 | $23,630 | $4,130 | $19,500 |
| 2015 | $2,041 | $23,630 | $4,130 | $19,500 |
| 2014 | $2,041 | $24,850 | $4,340 | $20,510 |
Source: Public Records
Map
Nearby Homes
- 3676 W 130th St
- 3628 W 129th St
- 3629 W 130th St
- 3684 W 133rd St
- 12813 North Rd
- 3596 W 128th St
- 3636 W 127th St
- 3661 W 134th St
- 3733 W 128th St
- 3582 W 126th St
- 3597 W 126th St
- 3774 W 135th St
- 3549 W 126th St
- 3502 W 128th St
- 3811 W 135th St
- 3728 W 136th St
- 3517 W 127th St
- 3569 W 136th St
- 3882 W 132nd St
- 3878 W 134th St
- 3696 W 130th St
- 3702 W 130th St
- 3686 W 130th St Unit DN
- 3704 W 130th St
- 3682 W 130th St
- 3706 W 130th St
- 3705 W 132nd St
- 3709 W 132nd St
- 3701 W 132nd St
- 3680 W 130th St
- 3699 W 132nd St
- 3713 W 132nd St
- 3695 W 130th St
- 3699 W 130th St
- 3695 W 132nd St
- 3717 W 132nd St
- 3703 W 130th St
- 3691 W 130th St
- 3716 W 130th St
- 3707 W 130th St