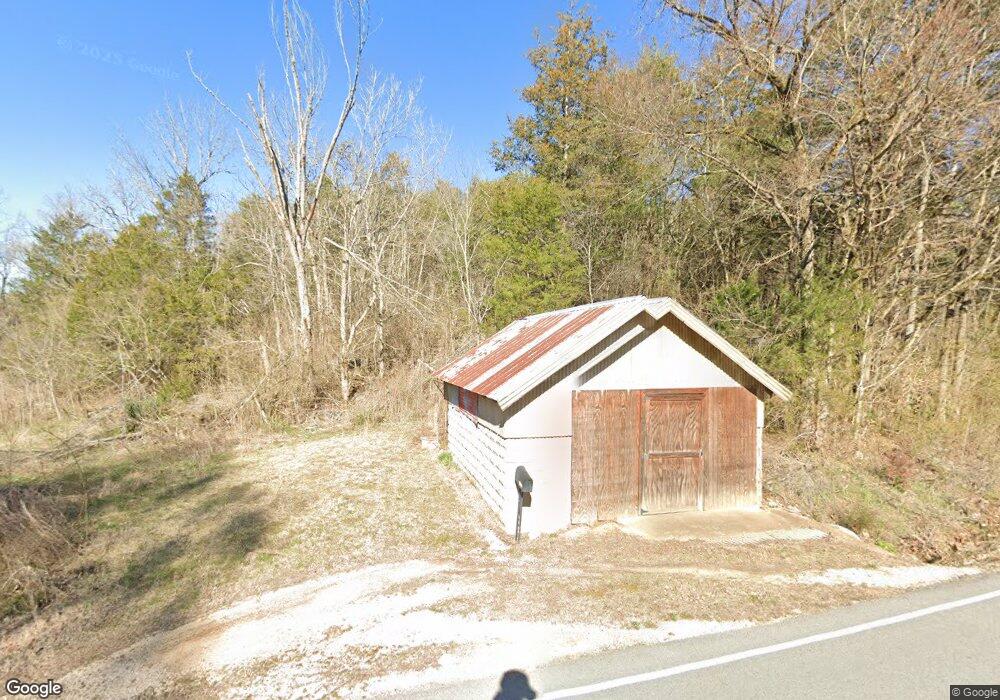
3700 Woods Prong Rd Linden, TN 37096
Estimated Value: $130,150 - $175,000
--
Bed
1
Bath
1,861
Sq Ft
$81/Sq Ft
Est. Value
About This Home
This home is located at 3700 Woods Prong Rd, Linden, TN 37096 and is currently estimated at $150,788, approximately $81 per square foot. 3700 Woods Prong Rd is a home located in Perry County.
Ownership History
Date
Name
Owned For
Owner Type
Purchase Details
Closed on
Jul 24, 2025
Sold by
Culp Paul D
Bought by
Culp Paul D and Avara Eric
Current Estimated Value
Purchase Details
Closed on
Dec 30, 2022
Sold by
Culp Paul D
Bought by
Avara Eric
Purchase Details
Closed on
Jul 20, 2021
Sold by
Culp Paul D
Bought by
South Forty Enterprises Llc
Purchase Details
Closed on
Jul 19, 2021
Sold by
Culp Paul D
Bought by
South Forty Enterprises Llc
Purchase Details
Closed on
May 25, 1983
Bought by
Culp Paul
Purchase Details
Closed on
Jan 22, 1952
Bought by
Culp Roy
Purchase Details
Closed on
Oct 14, 1947
Bought by
Culp Roy
Purchase Details
Closed on
Feb 7, 1947
Bought by
Culp Roy
Create a Home Valuation Report for This Property
The Home Valuation Report is an in-depth analysis detailing your home's value as well as a comparison with similar homes in the area
Home Values in the Area
Average Home Value in this Area
Purchase History
| Date | Buyer | Sale Price | Title Company |
|---|---|---|---|
| Culp Paul D | -- | None Listed On Document | |
| Culp Paul D | -- | None Listed On Document | |
| Avara Eric | $170,000 | -- | |
| Avara Eric | $170,000 | None Listed On Document | |
| South Forty Enterprises Llc | $46,000 | None Listed On Document | |
| Edwards Emanuel | $29,000 | None Listed On Document | |
| South Forty Enterprises Llc | $78,500 | None Available | |
| South Forty Enterprises Llc | $46,000 | None Available | |
| Edwards Emanuel | $29,000 | None Available | |
| Ellis Clayton L | $30,500 | None Available | |
| Ellis Clayton L | $30,500 | None Listed On Document | |
| Culp Paul | -- | -- | |
| Culp Roy | -- | -- | |
| Culp Roy | -- | -- | |
| Culp Roy | -- | -- |
Source: Public Records
Tax History Compared to Growth
Tax History
| Year | Tax Paid | Tax Assessment Tax Assessment Total Assessment is a certain percentage of the fair market value that is determined by local assessors to be the total taxable value of land and additions on the property. | Land | Improvement |
|---|---|---|---|---|
| 2025 | $551 | $23,975 | $0 | $0 |
| 2024 | $551 | $23,975 | $4,750 | $19,225 |
| 2023 | $551 | $23,975 | $4,750 | $19,225 |
| 2022 | $1,102 | $47,975 | $27,225 | $20,750 |
| 2021 | $1,332 | $57,950 | $37,200 | $20,750 |
| 2020 | $1,332 | $59,575 | $38,825 | $20,750 |
| 2019 | $1,292 | $52,100 | $31,775 | $20,325 |
| 2018 | $1,295 | $52,100 | $31,775 | $20,325 |
| 2017 | $1,280 | $52,225 | $31,900 | $20,325 |
| 2016 | $1,280 | $52,225 | $31,900 | $20,325 |
| 2015 | $1,255 | $52,225 | $31,900 | $20,325 |
| 2014 | $1,255 | $52,225 | $31,900 | $20,325 |
| 2013 | $1,055 | $43,919 | $0 | $0 |
Source: Public Records
Map
Nearby Homes
- 0 New Era Ridge Rd Unit RTC2991826
- 0 New Era Ridge Rd Unit 25219806
- 0 Sewell Branch Rd
- 168 Mackin Rd
- 1591 Marsh Creek Rd
- 3 Kellys Landing Rd
- 1 Kellys Landing Rd
- 2 Kellys Landing Dr
- Lot 1 Kellys Landing Rd
- Lot 3 Kellys Landing Rd
- Lot 2 Kellys Landing Rd
- 3202 Lego School Rd
- 1 New Era Landing Rd
- 339 Flatwoods School Rd
- 5273 Sinking Creek Rd
- 555 New Era Bluff Rd
- 0 New Era Landing Unit 17800450
- 0 New Era Landing Unit RTC2554791
- 1040 Whites Creek Ln
- 351 New Era Landing Rd