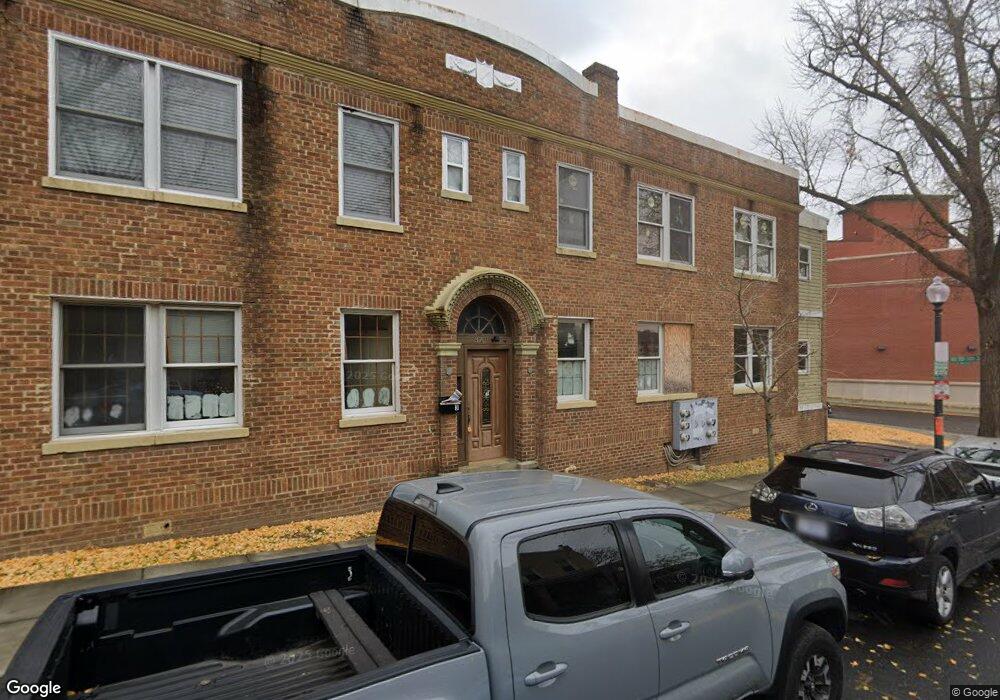
3701 9th St NW Washington, DC 20010
16th Street Heights NeighborhoodEstimated Value: $242,000 - $370,000
2
Beds
2
Baths
697
Sq Ft
$434/Sq Ft
Est. Value
About This Home
This home is located at 3701 9th St NW, Washington, DC 20010 and is currently estimated at $302,183, approximately $433 per square foot. 3701 9th St NW is a home located in District of Columbia with nearby schools including Raymond Education Campus, MacFarland Middle School, and Roosevelt High School @ MacFarland.
Ownership History
Date
Name
Owned For
Owner Type
Purchase Details
Closed on
Jul 18, 2025
Sold by
Bank Of America and Wamu Mortgage Pass-Through Certificates
Bought by
Sibilia Siding Llc
Current Estimated Value
Home Financials for this Owner
Home Financials are based on the most recent Mortgage that was taken out on this home.
Original Mortgage
$231,750
Outstanding Balance
$77,314
Interest Rate
1%
Mortgage Type
Construction
Estimated Equity
$224,869
Purchase Details
Closed on
Jul 8, 2025
Sold by
Clarke James E
Bought by
Wamu Mortgage Pass-Through Certificates Serie and Us Bank Na
Home Financials for this Owner
Home Financials are based on the most recent Mortgage that was taken out on this home.
Original Mortgage
$231,750
Outstanding Balance
$77,314
Interest Rate
1%
Mortgage Type
Construction
Estimated Equity
$224,869
Purchase Details
Closed on
Mar 31, 2006
Sold by
Duhart Detis
Bought by
Reid Robert
Home Financials for this Owner
Home Financials are based on the most recent Mortgage that was taken out on this home.
Original Mortgage
$280,500
Interest Rate
6.4%
Mortgage Type
New Conventional
Create a Home Valuation Report for This Property
The Home Valuation Report is an in-depth analysis detailing your home's value as well as a comparison with similar homes in the area
Home Values in the Area
Average Home Value in this Area
Purchase History
| Date | Buyer | Sale Price | Title Company |
|---|---|---|---|
| Sibilia Siding Llc | $250,500 | None Listed On Document | |
| Wamu Mortgage Pass-Through Certificates Serie | $283,050 | None Listed On Document | |
| Reid Robert | $330,000 | -- |
Source: Public Records
Mortgage History
| Date | Status | Borrower | Loan Amount |
|---|---|---|---|
| Open | Sibilia Siding Llc | $231,750 | |
| Previous Owner | Reid Robert | $280,500 |
Source: Public Records
Tax History Compared to Growth
Tax History
| Year | Tax Paid | Tax Assessment Tax Assessment Total Assessment is a certain percentage of the fair market value that is determined by local assessors to be the total taxable value of land and additions on the property. | Land | Improvement |
|---|---|---|---|---|
| 2025 | $3,169 | $388,460 | $116,540 | $271,920 |
| 2024 | $3,294 | $402,670 | $120,800 | $281,870 |
| 2023 | $3,508 | $427,410 | $128,220 | $299,190 |
| 2022 | $3,501 | $425,660 | $127,700 | $297,960 |
| 2021 | $3,411 | $414,590 | $124,380 | $290,210 |
| 2020 | $3,344 | $393,430 | $118,030 | $275,400 |
| 2019 | $3,214 | $385,160 | $115,550 | $269,610 |
| 2018 | $3,250 | $382,370 | $0 | $0 |
| 2017 | $3,166 | $372,490 | $0 | $0 |
| 2016 | $2,963 | $348,540 | $0 | $0 |
| 2015 | $2,518 | $296,290 | $0 | $0 |
| 2014 | $2,272 | $267,320 | $0 | $0 |
Source: Public Records
Map
Nearby Homes
- 825 Rock Creek Church Rd NW
- 3728 9th St NW
- 3656 New Hampshire Ave NW Unit 4
- 3656 New Hampshire Ave NW Unit 3
- 3644 New Hampshire Ave NW
- 755 Quebec Place NW
- 765 Princeton Place NW
- 3633 New Hampshire Ave NW
- 3619 Georgia Ave NW Unit 405
- 3624 Rock Creek Church Rd NW
- 749 Princeton Place NW
- 743 Princeton Place NW
- 1011 Quebec Place NW
- 707 Otis Place NW
- 710 Rock Creek Church Rd NW
- 3563 10th St NW
- 739 Newton Place NW Unit 104
- 747 Newton Place NW
- 1036 Quebec Place NW
- 709 Princeton Place NW
- 3701 9th St NW Unit 4
- 3701 9th St NW Unit 2
- 3701 9th St NW
- 3701 9th St NW
- 3701 9th St NW
- 3701 9th St NW
- 3701 9th St NW Unit 3
- 831 Rock Creek Church Rd NW
- 831 Rock Creek Church Rd NW Unit A
- 831 Rock Creek Church Rd NW Unit B
- 829 Rock Creek Church Rd NW
- 3715 9th St NW
- 3708 9th St NW
- 3717 9th St NW
- 3717 9th St NW Unit ONE
- 3717 9th St NW Unit TWO
- 3717 9th St NW Unit PENTHOUSE
- 3717 9th St NW Unit LOWER
- 3717 9th St NW Unit 2
- 3717 9th St NW Unit 1