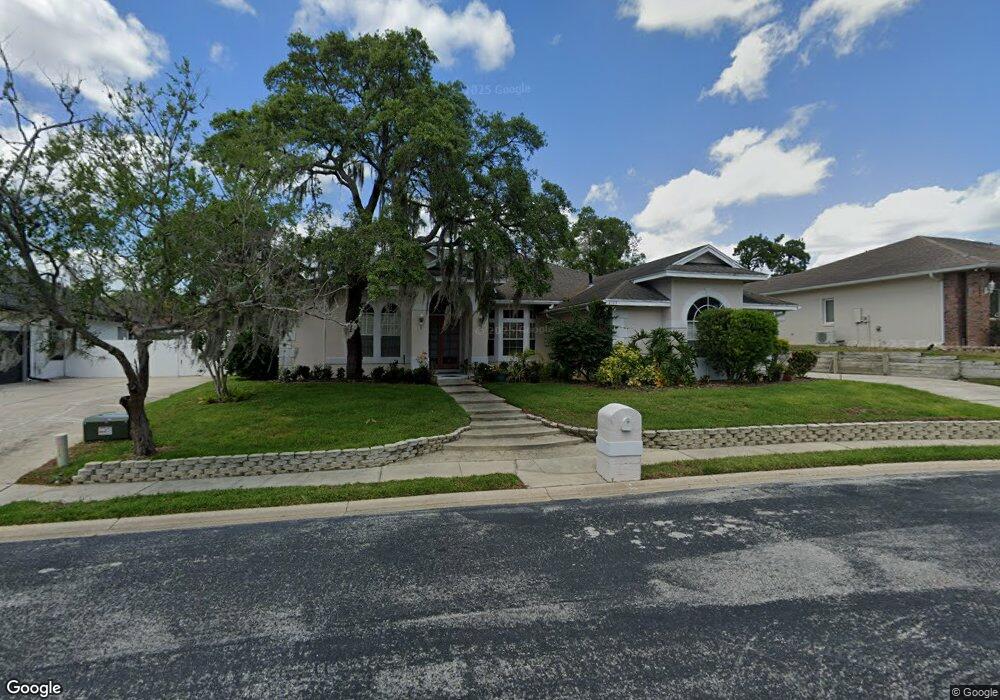
3705 Aldergate Place Casselberry, FL 32707
Lake Howell NeighborhoodEstimated Value: $560,951 - $593,000
4
Beds
4
Baths
2,389
Sq Ft
$240/Sq Ft
Est. Value
About This Home
This home is located at 3705 Aldergate Place, Casselberry, FL 32707 and is currently estimated at $572,988, approximately $239 per square foot. 3705 Aldergate Place is a home located in Seminole County with nearby schools including Red Bug Elementary School, Tuskawilla Middle School, and Lake Howell High School.
Ownership History
Date
Name
Owned For
Owner Type
Purchase Details
Closed on
Aug 22, 2002
Sold by
Jodi S Floyd I
Bought by
Mccatty Roy and Johnson Claudette
Current Estimated Value
Home Financials for this Owner
Home Financials are based on the most recent Mortgage that was taken out on this home.
Original Mortgage
$161,000
Outstanding Balance
$68,030
Interest Rate
6.53%
Mortgage Type
New Conventional
Estimated Equity
$504,958
Purchase Details
Closed on
Jan 4, 1995
Sold by
Floyd Bernard A and Floyd Jodi S
Bought by
Floyd Jodi S
Purchase Details
Closed on
Jan 1, 1995
Bought by
Johnson Claudette
Purchase Details
Closed on
Jul 27, 1993
Sold by
Floyd Bernard A and Floyd Jodi S
Bought by
Independence Mtg Corp Amer
Home Financials for this Owner
Home Financials are based on the most recent Mortgage that was taken out on this home.
Original Mortgage
$125,000
Interest Rate
7.34%
Purchase Details
Closed on
Apr 1, 1990
Bought by
Johnson Claudette
Create a Home Valuation Report for This Property
The Home Valuation Report is an in-depth analysis detailing your home's value as well as a comparison with similar homes in the area
Home Values in the Area
Average Home Value in this Area
Purchase History
| Date | Buyer | Sale Price | Title Company |
|---|---|---|---|
| Mccatty Roy | $230,000 | -- | |
| Floyd Jodi S | -- | -- | |
| Johnson Claudette | $100 | -- | |
| Independence Mtg Corp Amer | -- | -- | |
| Johnson Claudette | $40,000 | -- |
Source: Public Records
Mortgage History
| Date | Status | Borrower | Loan Amount |
|---|---|---|---|
| Open | Mccatty Roy | $161,000 | |
| Previous Owner | Mccatty Roy | $20,000 | |
| Previous Owner | Independence Mtg Corp Amer | $125,000 |
Source: Public Records
Tax History Compared to Growth
Tax History
| Year | Tax Paid | Tax Assessment Tax Assessment Total Assessment is a certain percentage of the fair market value that is determined by local assessors to be the total taxable value of land and additions on the property. | Land | Improvement |
|---|---|---|---|---|
| 2024 | $3,009 | $240,516 | -- | -- |
| 2023 | $2,937 | $233,511 | $0 | $0 |
| 2021 | $2,787 | $220,107 | $0 | $0 |
| 2020 | $2,763 | $217,068 | $0 | $0 |
| 2019 | $2,739 | $212,188 | $0 | $0 |
| 2018 | $2,704 | $208,232 | $0 | $0 |
| 2017 | $2,686 | $203,949 | $0 | $0 |
| 2016 | $2,739 | $201,152 | $0 | $0 |
| 2015 | $2,771 | $198,365 | $0 | $0 |
| 2014 | $2,477 | $196,791 | $0 | $0 |
Source: Public Records
Map
Nearby Homes
- 3760 Aldergate Place
- 4004 Garden Oak Ct
- 4087 Belle Meade Ct
- 4052 Falling Lilly Ct
- 4113 Hedge Maple Place Unit 4113
- 3876 White Birch Run
- 1309 Heritage Commons Dr
- 1057 Nodding Pines Way
- 3756 Idlebrook Cir Unit 100
- 3772 Idlebrook Cir Unit 100
- 3748 Idlebrook Cir Unit 202
- 3700 Idlebrook Cir Unit 200
- 1509 Sugarwood Cir
- 3635 S Saint Lucie Dr
- 1630 Gladiolas Dr
- 3895 Biscayne Dr
- 1421 Arbitus Cir
- 640 Tuskawilla Point Ln
- 724 Indian Ct
- 1713 W Cheryl Dr
- 3701 Aldergate Place
- 3709 Aldergate Place
- 4014 Gallagher Loop
- 4010 Gallagher Loop
- 4018 Gallagher Loop Unit 2
- 3713 Aldergate Place
- 3700 Aldergate Place
- 3704 Aldergate Place
- 4022 Gallagher Loop
- 3717 Aldergate Place
- 3721 Aldergate Place
- 4015 Gallagher Loop
- 4011 Gallagher Loop
- 1308 Banner Ct
- 3728 Aldergate Place
- 4019 Gallagher Loop
- 4026 Gallagher Loop
- 3725 Aldergate Place
- 3756 Aldergate Place
- 1300 Banner Ct