Estimated Value: $277,000 - $302,000
--
Bed
2
Baths
2,123
Sq Ft
$135/Sq Ft
Est. Value
About This Home
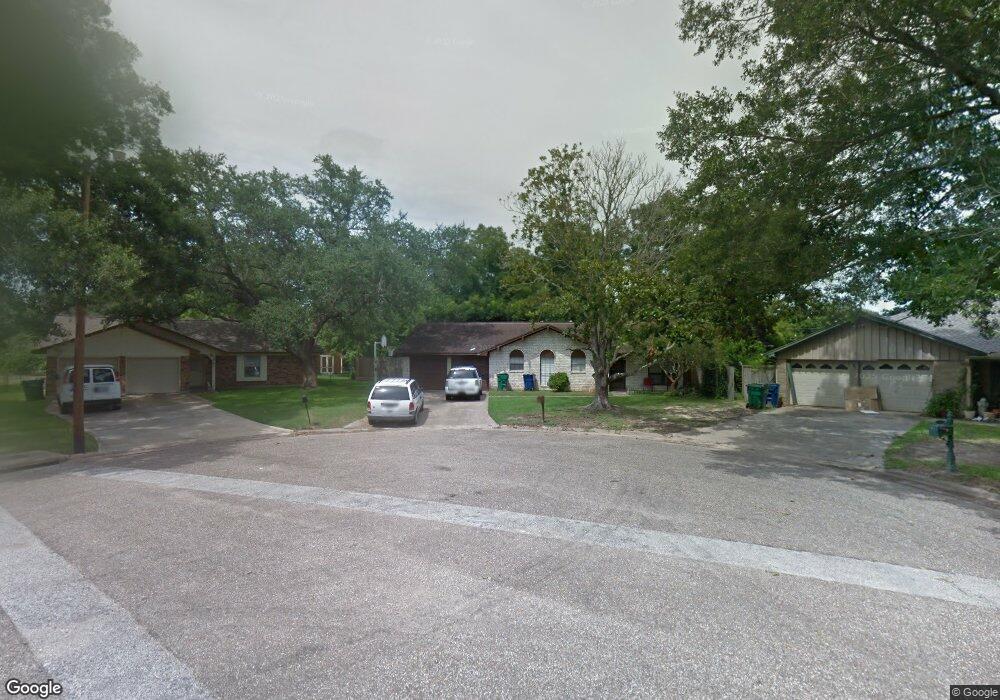
This home is located at 3705 Wilshire Dr, Alvin, TX 77511 and is currently estimated at $286,728, approximately $135 per square foot. 3705 Wilshire Dr is a home located in Brazoria County with nearby schools including R.L. Stevenson Primary School, Alvin Junior High School, and Alvin High School.
Ownership History
Date
Name
Owned For
Owner Type
Purchase Details
Closed on
Aug 12, 2013
Sold by
Shedlock Mickey Dean
Bought by
Alford Janice Lynn and Shedlock Janice Lynn
Current Estimated Value
Purchase Details
Closed on
Feb 17, 2012
Sold by
Shedlock Janice Lynn
Bought by
Whitlock David C and Whitlock Deysi C
Home Financials for this Owner
Home Financials are based on the most recent Mortgage that was taken out on this home.
Original Mortgage
$85,000
Outstanding Balance
$10,343
Interest Rate
3.95%
Mortgage Type
Seller Take Back
Estimated Equity
$276,385
Purchase Details
Closed on
Jun 10, 2011
Sold by
Christian Ruth Anna and Christian Ruth Anna Alford
Bought by
Shedlock Janice Lynn
Purchase Details
Closed on
Jan 4, 1995
Sold by
Joachim Herman and Joachim Carolyn
Bought by
Christian Ruth Anna
Home Financials for this Owner
Home Financials are based on the most recent Mortgage that was taken out on this home.
Original Mortgage
$37,000
Interest Rate
9.19%
Mortgage Type
Seller Take Back
Create a Home Valuation Report for This Property
The Home Valuation Report is an in-depth analysis detailing your home's value as well as a comparison with similar homes in the area
Home Values in the Area
Average Home Value in this Area
Purchase History
| Date | Buyer | Sale Price | Title Company |
|---|---|---|---|
| Alford Janice Lynn | -- | None Available | |
| Whitlock David C | -- | None Available | |
| Shedlock Janice Lynn | -- | None Available | |
| Christian Ruth Anna | -- | -- |
Source: Public Records
Mortgage History
| Date | Status | Borrower | Loan Amount |
|---|---|---|---|
| Open | Whitlock David C | $85,000 | |
| Previous Owner | Christian Ruth Anna | $37,000 |
Source: Public Records
Tax History Compared to Growth
Tax History
| Year | Tax Paid | Tax Assessment Tax Assessment Total Assessment is a certain percentage of the fair market value that is determined by local assessors to be the total taxable value of land and additions on the property. | Land | Improvement |
|---|---|---|---|---|
| 2025 | $4,085 | $258,492 | $38,530 | $252,650 |
| 2023 | $4,085 | $213,630 | $38,530 | $262,020 |
| 2022 | $5,327 | $194,209 | $24,080 | $225,020 |
| 2021 | $5,097 | $234,280 | $34,680 | $199,600 |
| 2020 | $4,698 | $209,530 | $28,900 | $180,630 |
| 2019 | $4,383 | $190,530 | $24,080 | $166,450 |
| 2018 | $3,991 | $183,600 | $24,080 | $159,520 |
| 2017 | $3,675 | $159,230 | $24,080 | $135,150 |
| 2016 | $3,340 | $161,440 | $24,080 | $137,360 |
| 2015 | $2,442 | $128,460 | $24,080 | $104,380 |
| 2014 | $2,442 | $90,600 | $24,080 | $66,520 |
Source: Public Records
Map
Nearby Homes
- 369 Windsor Square
- 3810 Westglen Dr
- 300 Mustang Rd
- 1145 Westglen Dr
- 3200 Fairway Dr
- 336 Paso Fino Dr
- 3111 Paso Fino Dr
- 3925 Larkspur St
- 111 Fairway Dr
- 201 W Timberlane Dr
- 610 Linda Ln
- 3221 County Road 890
- 607 Debbie Ln
- 817 Circle Way
- 00 Highway 6
- 1751 Rosharon Rd
- 0 W Highway 6 Unit 68293296
- 204 Hillcrest Dr
- 205 Hillcrest Dr
- 00 County Road 424
- 3701 Wilshire Dr
- 3706 Cambridge St
- 3709 Wilshire Dr
- 3710 Cambridge St
- 3702 Cambridge St
- 3702 Wilshire Dr
- 3713 Wilshire Dr
- 3714 Cambridge St
- 3706 Wilshire Dr
- 381 Windsor Square
- 3710 Wilshire Dr
- 379 Windsor Square
- 383 Windsor Square
- 3717 Wilshire Dr
- 3701 Cambridge St
- 3714 Wilshire Dr
- 377 Windsor Square
- 385 Windsor Square
- 3718 Cambridge St
- 3705 Cambridge St