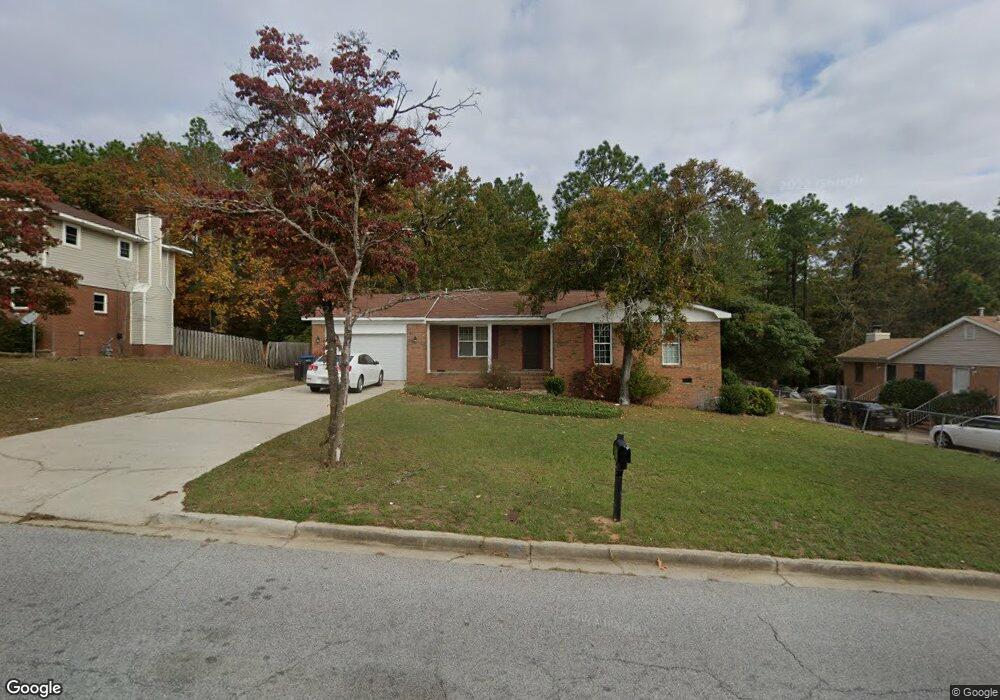
3705 Woodcock Dr Hephzibah, GA 30815
Windsor Spring NeighborhoodEstimated Value: $172,000 - $201,000
3
Beds
2
Baths
1,402
Sq Ft
$129/Sq Ft
Est. Value
About This Home
This home is located at 3705 Woodcock Dr, Hephzibah, GA 30815 and is currently estimated at $180,291, approximately $128 per square foot. 3705 Woodcock Dr is a home located in Richmond County with nearby schools including R.B. Hunt Elementary School, Jamestown Elementary School, and Glenn Hills Middle School.
Ownership History
Date
Name
Owned For
Owner Type
Purchase Details
Closed on
Apr 19, 2022
Sold by
Varnado Solomon
Bought by
Ortega Abimelec Arce and Perez Denia Yamileth
Current Estimated Value
Home Financials for this Owner
Home Financials are based on the most recent Mortgage that was taken out on this home.
Original Mortgage
$116,000
Outstanding Balance
$101,564
Interest Rate
3.85%
Mortgage Type
New Conventional
Estimated Equity
$78,727
Purchase Details
Closed on
Jan 9, 1992
Sold by
Veterans Affairs Secretary Of Veterans
Bought by
Varnado Solomon G
Purchase Details
Closed on
Jan 8, 1992
Sold by
Veterans Affairs Se
Bought by
Varnado Solomon G
Purchase Details
Closed on
Oct 19, 1990
Sold by
Barclaysamerican/Mortgage Corp Barclays
Bought by
Veterans Affairs Secretary Of
Purchase Details
Closed on
Sep 1, 1986
Sold by
Purcell Clifford A
Bought by
Fryer Willie H
Create a Home Valuation Report for This Property
The Home Valuation Report is an in-depth analysis detailing your home's value as well as a comparison with similar homes in the area
Home Values in the Area
Average Home Value in this Area
Purchase History
| Date | Buyer | Sale Price | Title Company |
|---|---|---|---|
| Ortega Abimelec Arce | $116,000 | -- | |
| Varnado Solomon G | -- | -- | |
| Varnado Solomon G | -- | -- | |
| Veterans Affairs Secretary Of | -- | -- | |
| Fryer Willie H | $66,500 | -- |
Source: Public Records
Mortgage History
| Date | Status | Borrower | Loan Amount |
|---|---|---|---|
| Open | Ortega Abimelec Arce | $116,000 |
Source: Public Records
Tax History Compared to Growth
Tax History
| Year | Tax Paid | Tax Assessment Tax Assessment Total Assessment is a certain percentage of the fair market value that is determined by local assessors to be the total taxable value of land and additions on the property. | Land | Improvement |
|---|---|---|---|---|
| 2025 | $1,921 | $59,004 | $6,480 | $52,524 |
| 2024 | $1,921 | $66,456 | $6,480 | $59,976 |
| 2023 | $1,571 | $46,400 | $5,360 | $41,040 |
| 2022 | $1,069 | $24,040 | $6,480 | $17,560 |
| 2021 | $1,015 | $20,140 | $6,480 | $13,660 |
| 2020 | $1,003 | $20,140 | $6,480 | $13,660 |
| 2019 | $1,037 | $19,816 | $6,480 | $13,336 |
| 2018 | $1,260 | $26,484 | $6,480 | $20,004 |
| 2017 | $1,221 | $26,484 | $6,480 | $20,004 |
| 2016 | $1,221 | $26,484 | $6,480 | $20,004 |
| 2015 | $1,228 | $26,484 | $6,480 | $20,004 |
| 2014 | $1,230 | $26,484 | $6,480 | $20,004 |
Source: Public Records
Map
Nearby Homes
- 3510 Andover Dr
- 3753 Woodcock Dr
- 3656 Woodcock Dr
- 3507 Mercedes Dr
- 2818 Cranbrook Dr
- 3621 Pebble Creek Dr
- 3623 Pebble Creek Dr
- 3629 Pebble Creek Dr
- 3627 Pebble Creek Dr
- 3625 Pebble Creek Dr
- 2813 Ridgecrest Dr
- 2924 Algernon Cir
- 4004 Rambling Way
- 3603 Pebble Creek Dr
- 407 Woodhazel Way
- 3011 White Sand Dr
- 3602 Pebble Creek Dr
- 3409 Saddle Horn Run
- 3606 Monmouth Rd
- 3512 Morgan Rd
- 3707 Woodcock Dr
- 3703 Woodcock Dr
- 3701 Woodcock Dr
- 3709 Woodcock Dr
- 3706 Woodcock Dr
- 3704 Woodcock Dr
- 3708 Woodcock Dr
- 3702 Woodcock Dr
- 3711 Woodcock Dr
- 3699 Woodcock Dr
- 2803 Ptarmigan Rd
- 3610 Chukar Ct
- 3712 Woodcock Dr
- 3713 Woodcock Dr
- 3612 Chukar Ct
- 3698 Woodcock Dr
- 2805 Ptarmigan Rd
- 3608 Chukar Ct
- 3714 Woodcock Dr
- 2804 Ptarmigan Rd