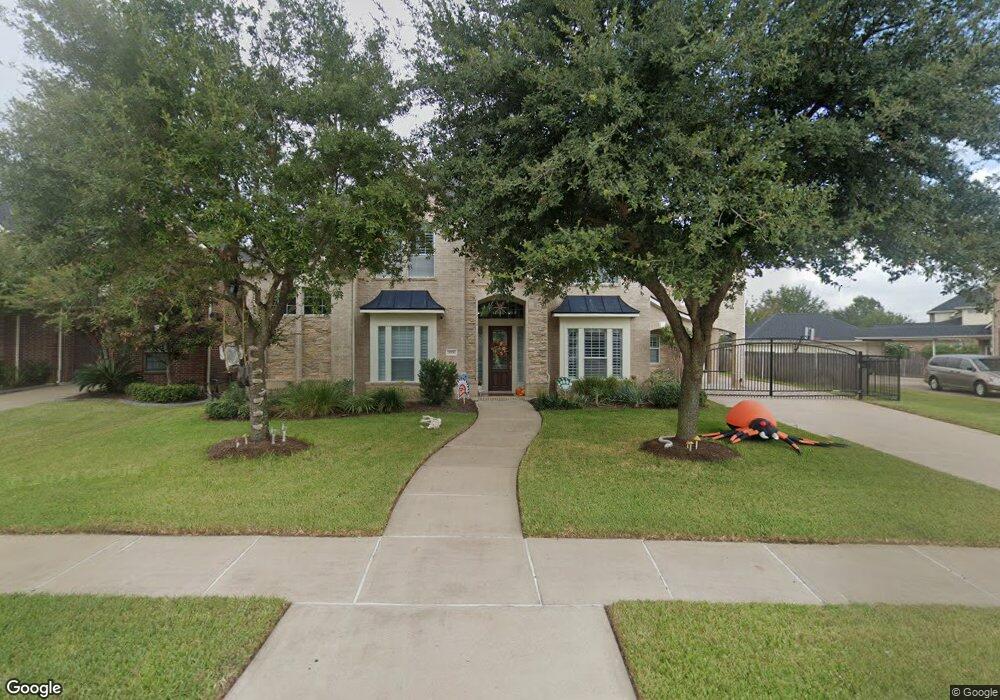
3706 Gable Grove Ln Katy, TX 77494
Grand Lakes NeighborhoodEstimated Value: $855,662 - $900,000
4
Beds
4
Baths
4,241
Sq Ft
$209/Sq Ft
Est. Value
About This Home
This home is located at 3706 Gable Grove Ln, Katy, TX 77494 and is currently estimated at $884,666, approximately $208 per square foot. 3706 Gable Grove Ln is a home located in Fort Bend County with nearby schools including Michael L. Griffin Elementary School, Beckendorff Junior High, and Seven Lakes High School.
Ownership History
Date
Name
Owned For
Owner Type
Purchase Details
Closed on
Jun 14, 2018
Sold by
Boldt Randy D and Boldt Kelly L
Bought by
Schneefuss Roland and Schneefuss Jessica
Current Estimated Value
Home Financials for this Owner
Home Financials are based on the most recent Mortgage that was taken out on this home.
Original Mortgage
$462,800
Outstanding Balance
$400,244
Interest Rate
4.5%
Mortgage Type
New Conventional
Estimated Equity
$484,422
Purchase Details
Closed on
Jul 8, 2008
Sold by
Miles Stuart L and Miles Deanna J
Bought by
Boldt Randy D and Boldt Kelly L
Purchase Details
Closed on
Aug 16, 2006
Sold by
Tmi Inc
Bought by
Miles Stuart L and Miles Deanna J
Home Financials for this Owner
Home Financials are based on the most recent Mortgage that was taken out on this home.
Original Mortgage
$402,142
Interest Rate
6.77%
Mortgage Type
Purchase Money Mortgage
Create a Home Valuation Report for This Property
The Home Valuation Report is an in-depth analysis detailing your home's value as well as a comparison with similar homes in the area
Home Values in the Area
Average Home Value in this Area
Purchase History
| Date | Buyer | Sale Price | Title Company |
|---|---|---|---|
| Schneefuss Roland | -- | Monarch Title Of Texas | |
| Boldt Randy D | -- | -- | |
| Miles Stuart L | -- | Chicago Title | |
| Boldt Randy D | -- | -- |
Source: Public Records
Mortgage History
| Date | Status | Borrower | Loan Amount |
|---|---|---|---|
| Open | Schneefuss Roland | $462,800 | |
| Previous Owner | Boldt Randy D | $402,142 |
Source: Public Records
Tax History Compared to Growth
Tax History
| Year | Tax Paid | Tax Assessment Tax Assessment Total Assessment is a certain percentage of the fair market value that is determined by local assessors to be the total taxable value of land and additions on the property. | Land | Improvement |
|---|---|---|---|---|
| 2025 | $12,035 | $856,512 | $163,800 | $711,854 |
| 2024 | $12,035 | $778,647 | $46,988 | $731,659 |
| 2023 | $10,965 | $707,861 | $0 | $710,178 |
| 2022 | $11,759 | $643,510 | $52,910 | $590,600 |
| 2021 | $12,429 | $585,010 | $126,000 | $459,010 |
| 2020 | $12,748 | $581,560 | $126,000 | $455,560 |
| 2019 | $13,992 | $580,430 | $126,000 | $454,430 |
| 2018 | $14,683 | $599,640 | $126,000 | $473,640 |
| 2017 | $14,410 | $585,510 | $126,000 | $459,510 |
| 2016 | $15,119 | $614,300 | $126,000 | $488,300 |
| 2015 | $11,907 | $619,320 | $126,000 | $493,320 |
| 2014 | $11,043 | $563,360 | $126,000 | $437,360 |
Source: Public Records
Map
Nearby Homes
- 5318 Thorngate Ct
- 5347 Greenbrae Ln
- 7803 Courtney Manor Ln
- 5339 Garnetfield Ln
- 5338 Garnetfield Ln
- 7819 Breezeway Bend Ln
- 5242 Garnetfield Ln
- 25218 Aspenlodge Ln
- 25222 Boulder Bend Ln
- 25239 Bentley Glen Ln
- 25270 Finchgrove Ln
- 5403 Round Hollow Ct
- 24910 Cinco Manor Ln
- 6915 Monarch Lake Ln
- 3826 Bell Hollow Ln
- 25110 Cinco Manor Ln
- 3538 Stanbury Place Ln
- 23003 Two Harbors Glen St
- 23506 Bainford Ct
- 7614 Emerald Meadow Ct
- 3710 Gable Grove Ln
- 3702 Gable Grove Ln
- 25023 Spring Ash Ln
- 25031 Spring Ash Ln
- 3618 Artesian Springs Ct
- 25019 Spring Ash Ln
- 3714 Gable Grove Ln
- 25035 Spring Ash Ln
- 25015 Spring Ash Ln
- 25039 Spring Ash Ln
- 2923 Gable Grove Ln
- 3703 Gable Grove Ln
- 25011 Spring Ash Ln
- 3711 Gable Grove Ln
- 3718 Gable Grove Ln
- 3614 Artesian Springs Ct
- 25007 Spring Ash Ln
- 25047 Spring Ash Ln
- 5331 Thorngate Ct
- 5334 Lantana Creek Ct