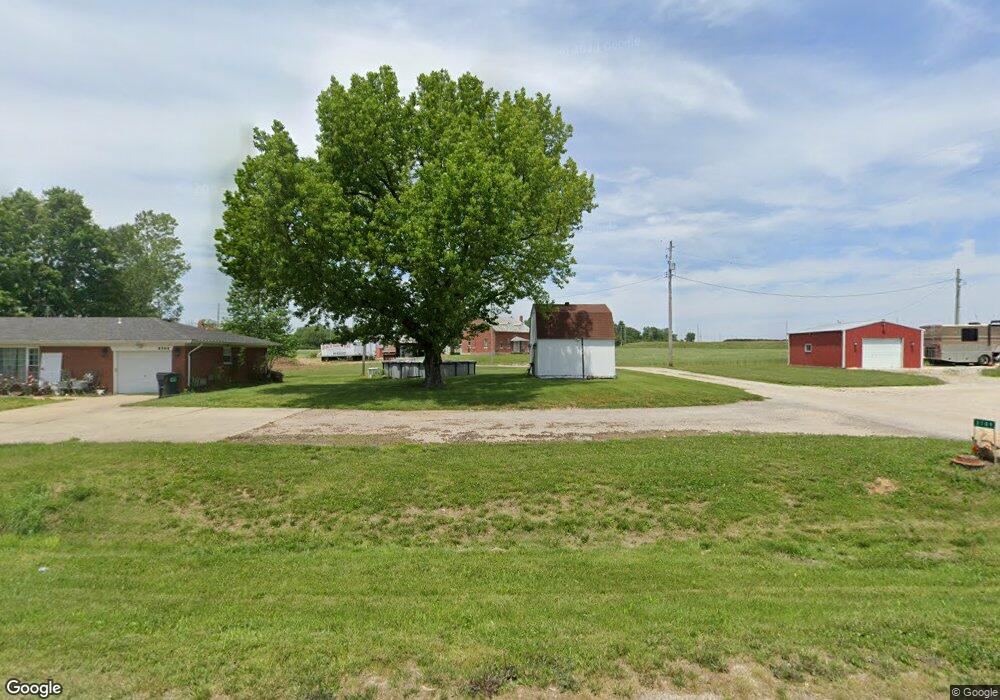
3709 Centreville Ave Belleville, IL 62226
Estimated Value: $194,000 - $346,000
--
Bed
--
Bath
1,408
Sq Ft
$199/Sq Ft
Est. Value
About This Home
This home is located at 3709 Centreville Ave, Belleville, IL 62226 and is currently estimated at $280,256, approximately $199 per square foot. 3709 Centreville Ave is a home located in St. Clair County with nearby schools including Westhaven Elementary School, Central Jr High School, and Governor French Academy.
Ownership History
Date
Name
Owned For
Owner Type
Purchase Details
Closed on
Jan 9, 2017
Sold by
Swistak John W and Swistak Michael L
Bought by
Froese Matt and Froese Josh
Current Estimated Value
Home Financials for this Owner
Home Financials are based on the most recent Mortgage that was taken out on this home.
Original Mortgage
$200,000
Interest Rate
4.4%
Mortgage Type
Commercial
Purchase Details
Closed on
Mar 29, 2012
Sold by
Swistak John W
Bought by
Swistak John W and Swistak Michael L
Purchase Details
Closed on
Mar 26, 2012
Sold by
Hazelip Carolyn J
Bought by
Swistak Ethel M
Purchase Details
Closed on
Dec 5, 2008
Sold by
Albert Martha
Bought by
Illinois Department Of Transportation
Purchase Details
Closed on
Sep 27, 2005
Sold by
Albert Martha
Bought by
Department Of Roads & Bridges
Create a Home Valuation Report for This Property
The Home Valuation Report is an in-depth analysis detailing your home's value as well as a comparison with similar homes in the area
Home Values in the Area
Average Home Value in this Area
Purchase History
| Date | Buyer | Sale Price | Title Company |
|---|---|---|---|
| Froese Matt | $250,000 | Illinois Title & Escrow | |
| Swistak John W | -- | None Available | |
| Swistak Ethel M | -- | None Available | |
| Illinois Department Of Transportation | $2,700 | None Available | |
| Department Of Roads & Bridges | $24,200 | -- |
Source: Public Records
Mortgage History
| Date | Status | Borrower | Loan Amount |
|---|---|---|---|
| Closed | Froese Matt | $200,000 |
Source: Public Records
Tax History Compared to Growth
Tax History
| Year | Tax Paid | Tax Assessment Tax Assessment Total Assessment is a certain percentage of the fair market value that is determined by local assessors to be the total taxable value of land and additions on the property. | Land | Improvement |
|---|---|---|---|---|
| 2024 | $4,368 | $61,440 | $12,376 | $49,064 |
| 2023 | $3,608 | $47,892 | $11,583 | $36,309 |
| 2022 | $3,364 | $43,559 | $10,330 | $33,229 |
| 2021 | $3,203 | $40,277 | $9,244 | $31,033 |
| 2020 | $3,062 | $46,245 | $8,259 | $37,986 |
| 2019 | $3,644 | $45,177 | $8,286 | $36,891 |
| 2018 | $3,520 | $43,183 | $7,176 | $36,007 |
| 2017 | $2,906 | $41,582 | $6,473 | $35,109 |
| 2016 | $2,897 | $39,787 | $5,810 | $33,977 |
| 2014 | $3,846 | $50,976 | $4,796 | $46,180 |
| 2013 | $589 | $50,731 | $4,551 | $46,180 |
Source: Public Records
Map
Nearby Homes
- 178 Wyndrose Estates Dr
- 7168 Mine Haul Rd
- 1909 Menard Dr
- 6009 Rolling Hills Ln
- 1824 Menard Dr
- 324 Lake Forest Dr
- 800 Springwood Dr
- 245 Summers Trace
- 401 Pecan Ln
- 633 Springwood Dr
- 45 Fenwood Dr
- 7400 Concordia Rd
- 4900 Barnwood Ln
- 4904 Barnwood Ln
- 1374 Rocky Creek Ct
- 1366 Radden Ct
- 6409 Balsam Ridge
- 33 Forest Gate Dr
- 1800 Roosevelt Ave
- 334 Spring Lake Rd
- 3705 Centreville Ave
- 3701 Centreville Ave
- 3700 Centreville Ave
- 3800 Centreville Ave
- 101 Wyndrose Estates Dr
- 101 Wyndrose Estates
- 115 Wyndrose Estates Dr
- 115 Wyndrose Estates Dr
- 115 Wyndrose Estates Dr Dr
- 115 Wyndrose Estates Dr Dr
- 115 Wyndrose Estates Dr
- 105 Wyndrose Estates Dr
- 3808 Centreville Ave
- 3601 Centreville Ave
- 100 Wyndrose Estates Dr
- 111 Wyndrose Estates Dr
- 111 Wyndrose Estates Dr
- 5361 Frank Scott Pkwy W
- 119 Wyndrose Estates Dr
- Lot #29 Wyndrose Estates