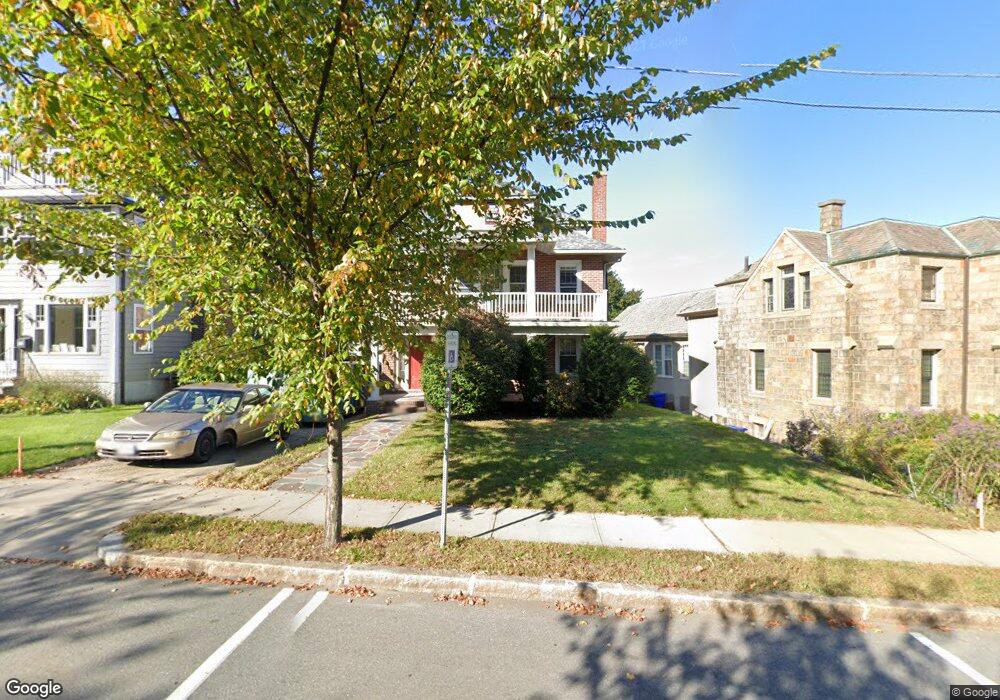
371 Belmont St Belmont, MA 02478
Cushing Square NeighborhoodEstimated Value: $940,000 - $1,519,000
5
Beds
2
Baths
3,277
Sq Ft
$387/Sq Ft
Est. Value
About This Home
This home is located at 371 Belmont St, Belmont, MA 02478 and is currently estimated at $1,267,991, approximately $386 per square foot. 371 Belmont St is a home located in Middlesex County with nearby schools including Roger Wellington Elementary School, Winthrop L Chenery Middle School, and Belmont High School.
Ownership History
Date
Name
Owned For
Owner Type
Purchase Details
Closed on
Sep 17, 1999
Sold by
371 Belmont Street Irt and Herbick Mark
Bought by
Torosian Kaspar M and Torosian Susan
Current Estimated Value
Home Financials for this Owner
Home Financials are based on the most recent Mortgage that was taken out on this home.
Original Mortgage
$307,000
Outstanding Balance
$91,085
Interest Rate
7.83%
Mortgage Type
Purchase Money Mortgage
Estimated Equity
$1,176,906
Create a Home Valuation Report for This Property
The Home Valuation Report is an in-depth analysis detailing your home's value as well as a comparison with similar homes in the area
Home Values in the Area
Average Home Value in this Area
Purchase History
| Date | Buyer | Sale Price | Title Company |
|---|---|---|---|
| Torosian Kaspar M | $390,000 | -- |
Source: Public Records
Mortgage History
| Date | Status | Borrower | Loan Amount |
|---|---|---|---|
| Open | Torosian Kaspar M | $307,000 |
Source: Public Records
Tax History Compared to Growth
Tax History
| Year | Tax Paid | Tax Assessment Tax Assessment Total Assessment is a certain percentage of the fair market value that is determined by local assessors to be the total taxable value of land and additions on the property. | Land | Improvement |
|---|---|---|---|---|
| 2025 | $9,385 | $824,000 | $696,000 | $128,000 |
| 2024 | $13,939 | $1,320,000 | $824,000 | $496,000 |
| 2023 | $13,814 | $1,229,000 | $778,000 | $451,000 |
| 2022 | $14,644 | $1,151,000 | $711,000 | $440,000 |
| 2021 | $12,495 | $1,269,000 | $890,000 | $379,000 |
| 2020 | $12,067 | $1,193,000 | $761,000 | $432,000 |
| 2019 | $11,393 | $1,036,000 | $610,000 | $426,000 |
| 2018 | $11,120 | $974,000 | $554,000 | $420,000 |
| 2017 | $11,434 | $901,000 | $487,000 | $414,000 |
| 2016 | $11,266 | $897,000 | $487,000 | $410,000 |
| 2015 | $9,998 | $775,000 | $419,000 | $356,000 |
Source: Public Records
Map
Nearby Homes
- 276 Belmont St Unit 1
- 147 Langdon Ave Unit 149
- 456 Belmont St Unit 10
- 456 Belmont St Unit 21
- 133 Hillside Rd
- 81 Winsor Ave
- 73 Foster Rd Unit 2
- 56-58 Edgecliff Rd
- 87 Templeton Pkwy Unit 3
- 125 Trapelo Rd Unit 21
- 125 Trapelo Rd Unit 23
- 10 Marlboro St Unit 1
- 30 Unity Ave Unit 30
- 1 Clayton St
- 163 Belmont St
- 43 Irma Ave Unit 43
- 68 Barnard Ave
- 15-17 Dexter Ave
- 16 Ericsson St
- 36 Madison St
- 371 Belmont St Unit 1
- 371 Belmont St Unit 2
- 379 Belmont St Unit 379
- 379 Belmont St Unit 381
- 379 Belmont St Unit 1
- 381 Belmont St
- 385 Belmont St
- 385 Belmont St Unit 2
- 383 Belmont St Unit 385
- 383 Belmont St Unit 1
- 47 Lawndale St
- 45 Lawndale St
- 53 Lawndale St Unit 55
- 37 Lawndale St Unit 39
- 393 Belmont St
- 33 Lawndale St
- 35 Lawndale St
- 33 Lawndale St Unit 1
- 370 Belmont St
- 395 Belmont St Unit 397