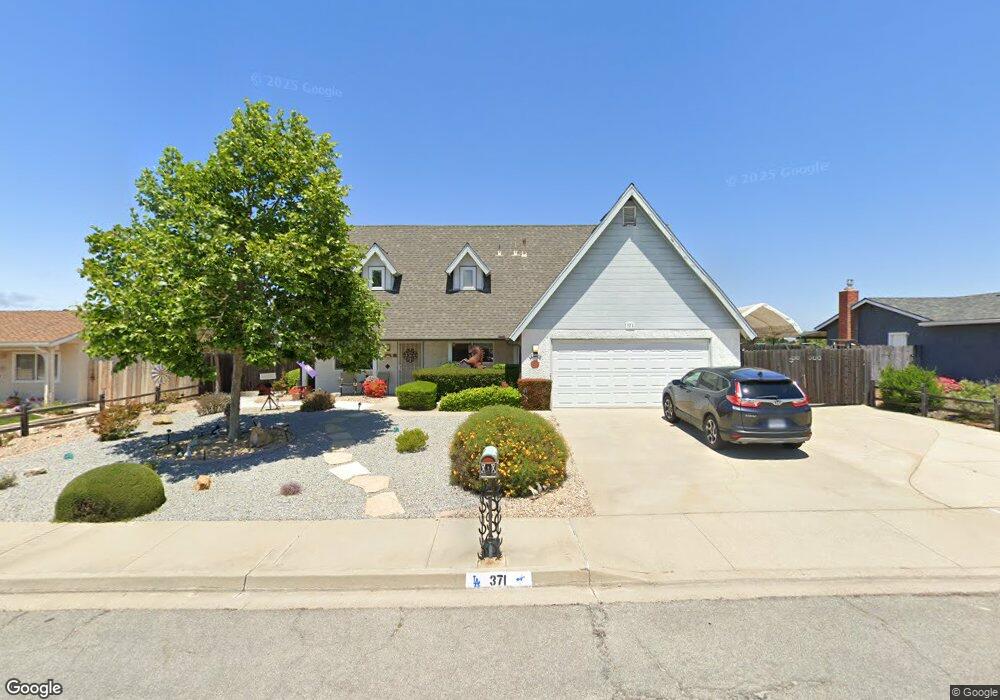
371 El Cerrito Unit 1 Santa Maria, CA 93455
Estimated Value: $789,000 - $851,000
4
Beds
3
Baths
2,398
Sq Ft
$342/Sq Ft
Est. Value
About This Home
This home is located at 371 El Cerrito Unit 1, Santa Maria, CA 93455 and is currently estimated at $819,753, approximately $341 per square foot. 371 El Cerrito Unit 1 is a home located in Santa Barbara County with nearby schools including Pine Grove Elementary School, Orcutt Junior High School, and Ernest Righetti High School.
Ownership History
Date
Name
Owned For
Owner Type
Purchase Details
Closed on
Oct 22, 2002
Sold by
Mooney Richard H and Mooney Sandra L
Bought by
Mooney Richard H and Mooney Sandra L
Current Estimated Value
Purchase Details
Closed on
May 24, 2002
Sold by
Crump Walter Ennis
Bought by
Mooney Richard H and Mooney Sandra L
Home Financials for this Owner
Home Financials are based on the most recent Mortgage that was taken out on this home.
Original Mortgage
$70,000
Interest Rate
6.38%
Create a Home Valuation Report for This Property
The Home Valuation Report is an in-depth analysis detailing your home's value as well as a comparison with similar homes in the area
Home Values in the Area
Average Home Value in this Area
Purchase History
| Date | Buyer | Sale Price | Title Company |
|---|---|---|---|
| Mooney Richard H | -- | -- | |
| Mooney Richard H | $329,000 | Lawyers Title Company |
Source: Public Records
Mortgage History
| Date | Status | Borrower | Loan Amount |
|---|---|---|---|
| Closed | Mooney Richard H | $70,000 |
Source: Public Records
Tax History Compared to Growth
Tax History
| Year | Tax Paid | Tax Assessment Tax Assessment Total Assessment is a certain percentage of the fair market value that is determined by local assessors to be the total taxable value of land and additions on the property. | Land | Improvement |
|---|---|---|---|---|
| 2025 | $4,755 | $340,291 | $83,258 | $257,033 |
| 2023 | $4,755 | $327,079 | $80,026 | $247,053 |
| 2022 | $4,615 | $320,666 | $78,457 | $242,209 |
| 2021 | $4,520 | $314,379 | $76,919 | $237,460 |
| 2020 | $4,484 | $311,157 | $76,131 | $235,026 |
| 2019 | $4,432 | $305,057 | $74,639 | $230,418 |
| 2018 | $4,363 | $299,076 | $73,176 | $225,900 |
| 2017 | $4,206 | $293,213 | $71,742 | $221,471 |
| 2016 | $4,048 | $287,465 | $70,336 | $217,129 |
| 2014 | $3,781 | $277,602 | $67,923 | $209,679 |
Source: Public Records
Map
Nearby Homes