Estimated Value: $557,047 - $663,000
--
Bed
4
Baths
3,333
Sq Ft
$181/Sq Ft
Est. Value
About This Home
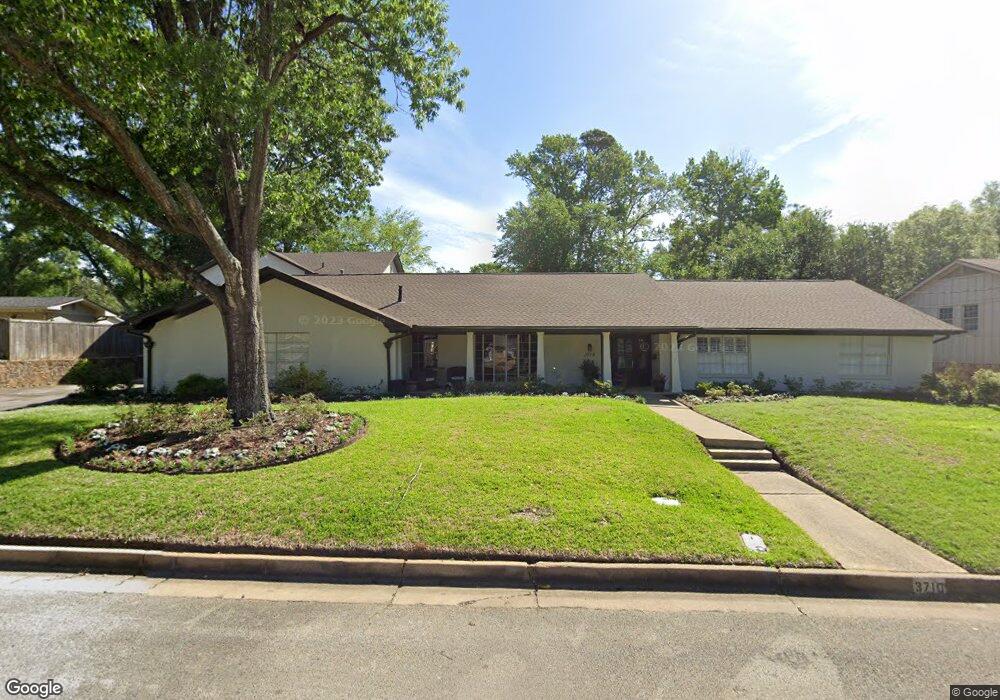
This home is located at 3710 3710 Wynnwood, Tyler, TX 75701 and is currently estimated at $603,012, approximately $180 per square foot. 3710 3710 Wynnwood is a home located in Smith County with nearby schools including Woods Elementary School, Hubbard Middle School, and Tyler Legacy High School.
Ownership History
Date
Name
Owned For
Owner Type
Purchase Details
Closed on
Oct 18, 2023
Sold by
Faulks Kristy S
Bought by
Faulks Michael Shane
Current Estimated Value
Purchase Details
Closed on
Jun 11, 2020
Sold by
Valdez Eulogio
Bought by
Valdez Susano
Home Financials for this Owner
Home Financials are based on the most recent Mortgage that was taken out on this home.
Original Mortgage
$383,800
Interest Rate
3.1%
Mortgage Type
New Conventional
Purchase Details
Closed on
Mar 10, 2016
Sold by
Parsons Elizabeth Ann Carroway
Bought by
Faulks Kristy Michelle
Purchase Details
Closed on
Aug 3, 2015
Sold by
Currin Kristi Killian and Currin James Byron
Bought by
Faulks Micheal Shane and Faulks Kristy S
Home Financials for this Owner
Home Financials are based on the most recent Mortgage that was taken out on this home.
Original Mortgage
$360,800
Interest Rate
4.06%
Mortgage Type
New Conventional
Create a Home Valuation Report for This Property
The Home Valuation Report is an in-depth analysis detailing your home's value as well as a comparison with similar homes in the area
Home Values in the Area
Average Home Value in this Area
Purchase History
| Date | Buyer | Sale Price | Title Company |
|---|---|---|---|
| Faulks Michael Shane | -- | None Listed On Document | |
| Valdez Susano | -- | None Available | |
| Faulks Kristy Michelle | -- | None Available | |
| Faulks Micheal Shane | -- | None Available |
Source: Public Records
Mortgage History
| Date | Status | Borrower | Loan Amount |
|---|---|---|---|
| Previous Owner | Valdez Susano | $383,800 | |
| Previous Owner | Faulks Micheal Shane | $360,800 |
Source: Public Records
Tax History Compared to Growth
Tax History
| Year | Tax Paid | Tax Assessment Tax Assessment Total Assessment is a certain percentage of the fair market value that is determined by local assessors to be the total taxable value of land and additions on the property. | Land | Improvement |
|---|---|---|---|---|
| 2025 | $5,112 | $483,601 | $63,867 | $419,734 |
| 2024 | $5,112 | $523,863 | $57,320 | $466,543 |
| 2023 | $8,688 | $607,493 | $57,320 | $550,173 |
| 2022 | $8,876 | $453,068 | $49,131 | $403,937 |
| 2021 | $8,788 | $418,891 | $49,131 | $369,760 |
| 2020 | $9,070 | $423,848 | $49,131 | $374,717 |
| 2019 | $8,486 | $388,077 | $32,754 | $355,323 |
| 2018 | $7,972 | $366,529 | $32,754 | $333,775 |
| 2017 | $7,825 | $366,529 | $32,754 | $333,775 |
| 2016 | $7,211 | $337,753 | $32,754 | $304,999 |
| 2015 | $6,537 | $326,525 | $32,754 | $293,771 |
| 2014 | $6,537 | $320,641 | $32,754 | $287,887 |
Source: Public Records
Map
Nearby Homes
- 3710 Bain Place
- 3712 Colony Park Dr
- 3511 S Keaton Ave
- 4021 New Copeland Rd
- 3523 S Cameron Ave
- 1107 Pinedale Place
- 3210 S Donnybrook Ave
- 1113 E Amherst Dr
- 3202 S Donnybrook Ave
- 1018 Pollard Dr
- 1408 Westfield St
- 1505 Glenrose St
- 1101 Clyde Dr
- 3235 Curtis Dr
- 3400 Birdwell Dr
- 4211 Birdwell Dr
- 315 Ridgecrest Dr
- 4601 Cambridge Dr
- 1024 Clyde Dr
- 3215 Curtis Dr
- 3710 Wynnwood Dr
- 3704 Wynnwood Dr
- 3802 3802 Wynnwood
- 3802 Wynnwood Dr
- 3711 Bain Place
- 3707 Wynnwood Dr
- 3715 Wynnwood Dr
- 3721 Bain Place
- 3623 Wynnwood Dr
- 3803 Wynnwood Dr
- 3618 Wynnwood Dr
- 3618 3618 Wynnwood Dr
- 3701 Bain Place
- 3827 Fry Ave
- 3835 Fry Ave
- 3819 Fry Ave
- 3819 3819 Fry Ave
- 3712 Colony Park Dr
- 3712/3714 Colony Park Dr
- 3714 Colony Park Dr