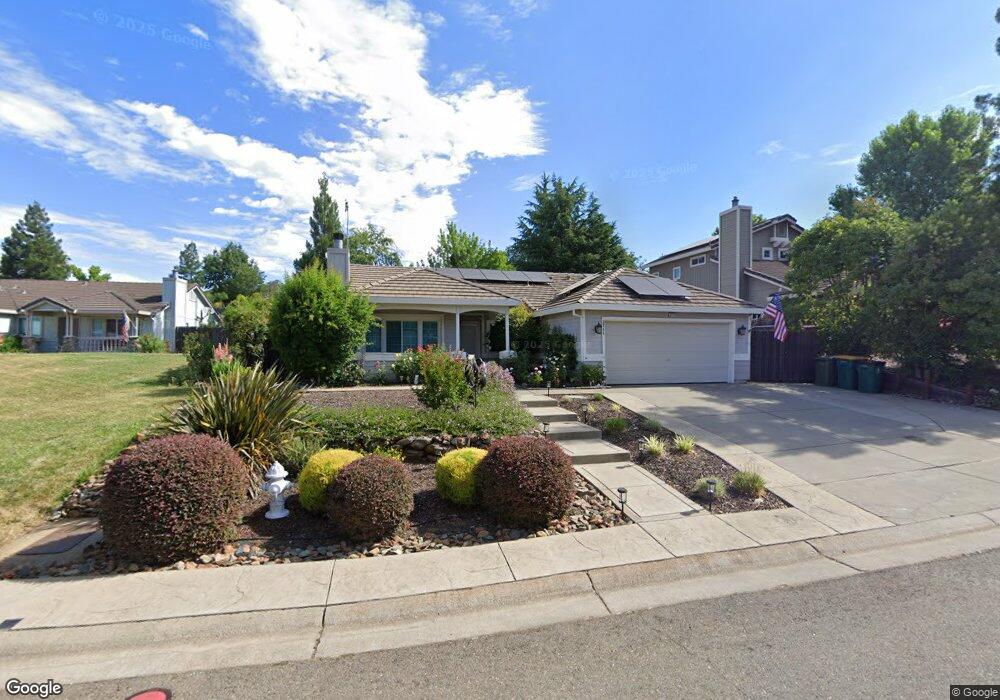
3711 Almaden Ct El Dorado Hills, CA 95762
Estimated Value: $492,000 - $661,000
3
Beds
2
Baths
1,425
Sq Ft
$426/Sq Ft
Est. Value
About This Home
This home is located at 3711 Almaden Ct, El Dorado Hills, CA 95762 and is currently estimated at $607,712, approximately $426 per square foot. 3711 Almaden Ct is a home located in El Dorado County with nearby schools including Green Valley Elementary School, Pleasant Grove Middle School, and Ponderosa High School.
Ownership History
Date
Name
Owned For
Owner Type
Purchase Details
Closed on
Jan 18, 2007
Sold by
Broumand Kevin D
Bought by
Broumand Kevin D
Current Estimated Value
Home Financials for this Owner
Home Financials are based on the most recent Mortgage that was taken out on this home.
Original Mortgage
$210,000
Outstanding Balance
$124,796
Interest Rate
6.11%
Mortgage Type
New Conventional
Estimated Equity
$482,916
Purchase Details
Closed on
Apr 23, 2002
Sold by
Elliott Cheri
Bought by
Broumand Kevin D
Home Financials for this Owner
Home Financials are based on the most recent Mortgage that was taken out on this home.
Original Mortgage
$215,200
Interest Rate
7.08%
Purchase Details
Closed on
Oct 30, 1996
Sold by
The Forecast Group Lp
Bought by
Elliott Cheri
Home Financials for this Owner
Home Financials are based on the most recent Mortgage that was taken out on this home.
Original Mortgage
$139,616
Interest Rate
8.11%
Mortgage Type
FHA
Create a Home Valuation Report for This Property
The Home Valuation Report is an in-depth analysis detailing your home's value as well as a comparison with similar homes in the area
Home Values in the Area
Average Home Value in this Area
Purchase History
| Date | Buyer | Sale Price | Title Company |
|---|---|---|---|
| Broumand Kevin D | -- | First American Title Ins Co | |
| Broumand Kevin D | $269,000 | Chicago Title Co | |
| Elliott Cheri | $152,000 | First American Title Co |
Source: Public Records
Mortgage History
| Date | Status | Borrower | Loan Amount |
|---|---|---|---|
| Open | Broumand Kevin D | $210,000 | |
| Closed | Broumand Kevin D | $215,200 | |
| Previous Owner | Elliott Cheri | $139,616 | |
| Closed | Broumand Kevin D | $40,350 |
Source: Public Records
Tax History Compared to Growth
Tax History
| Year | Tax Paid | Tax Assessment Tax Assessment Total Assessment is a certain percentage of the fair market value that is determined by local assessors to be the total taxable value of land and additions on the property. | Land | Improvement |
|---|---|---|---|---|
| 2025 | $4,394 | $397,366 | $118,171 | $279,195 |
| 2024 | $4,394 | $389,575 | $115,854 | $273,721 |
| 2023 | $4,035 | $381,937 | $113,583 | $268,354 |
| 2022 | $3,979 | $374,449 | $111,356 | $263,093 |
| 2021 | $4,229 | $367,108 | $109,173 | $257,935 |
| 2020 | $3,973 | $363,345 | $108,054 | $255,291 |
| 2019 | $3,910 | $356,222 | $105,936 | $250,286 |
| 2018 | $3,792 | $349,238 | $103,859 | $245,379 |
| 2017 | $3,734 | $342,391 | $101,823 | $240,568 |
| 2016 | $3,684 | $335,678 | $99,827 | $235,851 |
| 2015 | $3,561 | $330,638 | $98,329 | $232,309 |
| 2014 | $3,561 | $324,162 | $96,403 | $227,759 |
Source: Public Records
Map
Nearby Homes
- 4004 Prairie Falcon Dr
- 423 Oeste Ln
- 3182 Birmingham Way
- 7111 Cinnamon Teal Way
- 7137 Cinnamon Teal Way
- 4066 Plateau Cir
- 5505 Crimson Ct
- 5510 Crimson Ct
- 3180 Woodleigh Ln
- 1247 Senegal Way
- 7020 Talmage Ct
- 3021 Robles Ct
- 3341 Rancho Tierra Ct
- 2871 Vista Verde Dr
- 0 Wilkinson Rd
- 0 Wilkinson Rd
- 2940 Pasada Rd
- 3334 Hollow Oak Dr
- 3271 Woodleigh Ln
- 2980 Calido Ct
- 3717 Almaden Ct
- 3707 Almaden Ct
- 3476 Tea Rose Dr
- 3470 Tea Rose Dr
- 3703 Almaden Ct
- 5156 Camanche Way
- 5160 Camanche Way
- 5148 Camanche Way
- 3464 Tea Rose Dr
- 3486 Tea Rose Dr
- 5140 Camanche Way
- 3710 Almaden Ct
- 3716 Almaden Ct
- 3706 Almaden Ct
- 5132 Camanche Way
- 3701 Almaden Ct
- 3702 Almaden Ct
- 3456 Tea Rose Dr
- 3700 Almaden Ct
- 3494 Tea Rose Dr