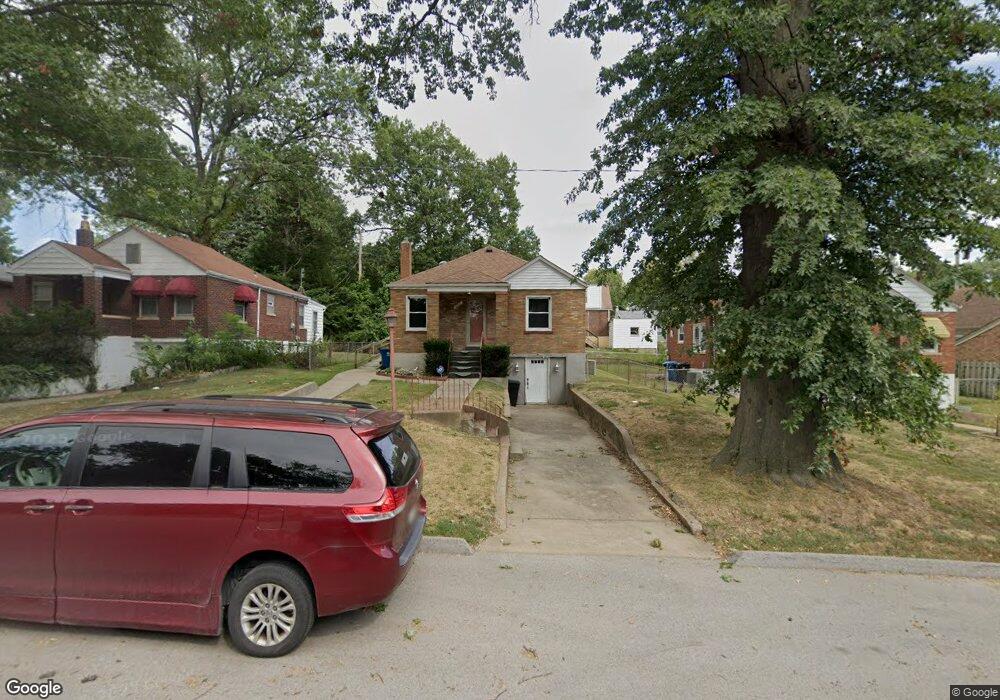
3712 Eminence Blvd Saint Louis, MO 63114
Estimated Value: $148,013 - $176,000
2
Beds
1
Bath
1,215
Sq Ft
$131/Sq Ft
Est. Value
About This Home
This home is located at 3712 Eminence Blvd, Saint Louis, MO 63114 and is currently estimated at $159,003, approximately $130 per square foot. 3712 Eminence Blvd is a home located in St. Louis County with nearby schools including Marvin Elementary School, Ritenour Middle School, and Ritenour Senior High School.
Ownership History
Date
Name
Owned For
Owner Type
Purchase Details
Closed on
Feb 11, 2003
Sold by
Rossi Peter and Rossi Sihn
Bought by
Rossi Sihn
Current Estimated Value
Home Financials for this Owner
Home Financials are based on the most recent Mortgage that was taken out on this home.
Original Mortgage
$79,000
Outstanding Balance
$33,710
Interest Rate
5.9%
Estimated Equity
$125,293
Purchase Details
Closed on
Jul 28, 2000
Sold by
Joe Wallace Perry and Joe Janet
Bought by
Rossi Peter and Rossi Peter F
Home Financials for this Owner
Home Financials are based on the most recent Mortgage that was taken out on this home.
Original Mortgage
$73,600
Interest Rate
8.23%
Mortgage Type
FHA
Purchase Details
Closed on
Jun 2, 2000
Sold by
Harbor Financial Mtg Corp
Bought by
Hud
Home Financials for this Owner
Home Financials are based on the most recent Mortgage that was taken out on this home.
Original Mortgage
$73,600
Interest Rate
8.23%
Mortgage Type
FHA
Create a Home Valuation Report for This Property
The Home Valuation Report is an in-depth analysis detailing your home's value as well as a comparison with similar homes in the area
Home Values in the Area
Average Home Value in this Area
Purchase History
| Date | Buyer | Sale Price | Title Company |
|---|---|---|---|
| Rossi Sihn | -- | Nations Title Agency Inc | |
| Rossi Peter | $74,000 | -- | |
| Hud | $43,730 | -- |
Source: Public Records
Mortgage History
| Date | Status | Borrower | Loan Amount |
|---|---|---|---|
| Open | Rossi Sihn | $79,000 | |
| Closed | Rossi Peter | $73,600 |
Source: Public Records
Tax History Compared to Growth
Tax History
| Year | Tax Paid | Tax Assessment Tax Assessment Total Assessment is a certain percentage of the fair market value that is determined by local assessors to be the total taxable value of land and additions on the property. | Land | Improvement |
|---|---|---|---|---|
| 2025 | $1,868 | $27,090 | $7,600 | $19,490 |
| 2024 | $1,868 | $21,570 | $1,520 | $20,050 |
| 2023 | $1,831 | $21,570 | $1,520 | $20,050 |
| 2022 | $1,699 | $17,520 | $3,040 | $14,480 |
| 2021 | $1,698 | $17,520 | $3,040 | $14,480 |
| 2020 | $1,628 | $15,430 | $3,800 | $11,630 |
| 2019 | $1,610 | $15,430 | $3,800 | $11,630 |
| 2018 | $1,624 | $14,020 | $1,900 | $12,120 |
| 2017 | $1,550 | $14,020 | $1,900 | $12,120 |
| 2016 | $1,461 | $13,280 | $2,280 | $11,000 |
| 2015 | $1,494 | $13,280 | $2,280 | $11,000 |
| 2014 | -- | $14,250 | $1,370 | $12,880 |
Source: Public Records
Map
Nearby Homes
- 9015 Mcnulty Dr
- 9060 Patrick Dr
- 9047 Kathlyn Dr
- 9018 Gedde Ave
- 9207 Bataan Dr
- 8909 Tutwiler Ave
- 3562 Boswell Ave
- 3563 Boswell Ave
- 9033 Trefore Ave
- 13 Jonell Ct
- 9006 Bessemer Ave
- 8718 Mavis Place
- 4210 Gordon Ave
- 8687 Belhaven Dr
- 3534 Calvert Ave
- 8728 Susan Ave
- 4359 Boswell Ave
- 3937 Madeline Dr
- 4421 Boswell Ave
- 9427 Bataan Dr Unit 2
- 3716 Eminence Blvd
- 3708 Eminence Blvd
- 3708 Eminence Blvd
- 3713 Killarney Ct
- 3704 Eminence Blvd
- 3720 Eminence Blvd
- 3717 Killarney Ct
- 3724 Eminence Blvd
- 3709 Eminence Blvd
- 3705 Killarney Ct
- 8947 Mcnulty Dr
- 9001 Mcnulty Dr
- 8944 Bobb Ave
- 3715 Eminence Blvd
- 3716 Killarney Ct
- 8940 Bobb Ave
- 8937 Mcnulty Dr
- 3719 Eminence Blvd
- 3728 Eminence Blvd
- 3712 Killarney Ct