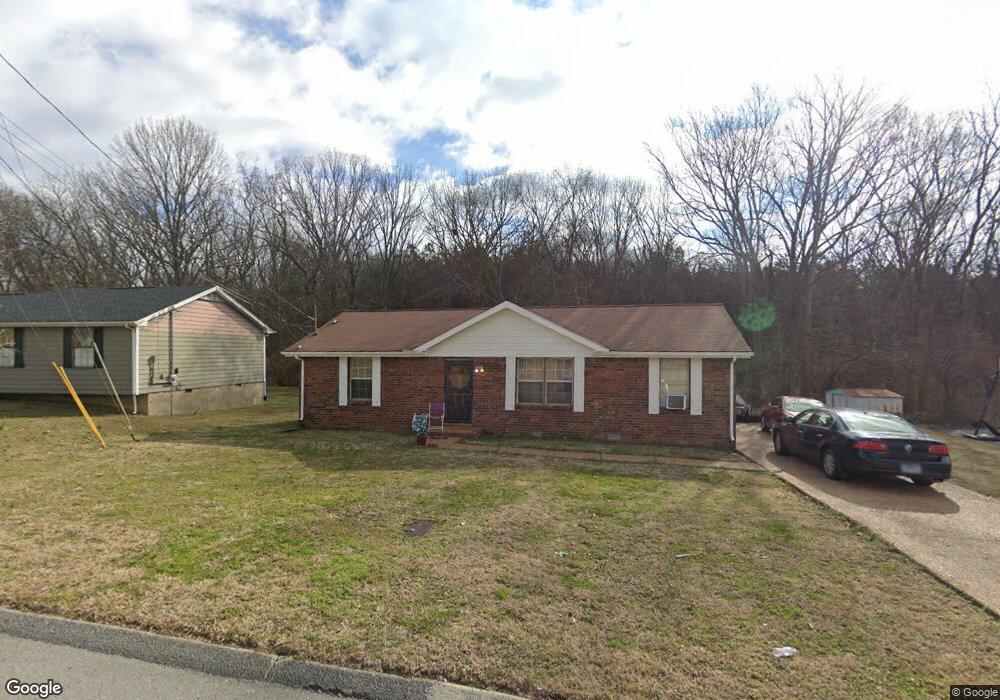
3713 Chesapeake Dr Nashville, TN 37207
Bellshire Terrace NeighborhoodEstimated Value: $255,000 - $323,426
3
Beds
2
Baths
1,104
Sq Ft
$263/Sq Ft
Est. Value
About This Home
This home is located at 3713 Chesapeake Dr, Nashville, TN 37207 and is currently estimated at $290,107, approximately $262 per square foot. 3713 Chesapeake Dr is a home located in Davidson County with nearby schools including Bellshire Elementary Design Center, Madison Middle Prep, and Hunters Lane Comprehensive High School.
Ownership History
Date
Name
Owned For
Owner Type
Purchase Details
Closed on
Aug 21, 2016
Sold by
Bell Deanie
Bought by
Bell Jerome
Current Estimated Value
Purchase Details
Closed on
Mar 6, 2006
Sold by
Bell Joseph E and Bell Deanie M
Bought by
Bell Joseph E and Bell Deanie M
Home Financials for this Owner
Home Financials are based on the most recent Mortgage that was taken out on this home.
Original Mortgage
$83,200
Outstanding Balance
$47,077
Interest Rate
6.19%
Mortgage Type
Stand Alone Refi Refinance Of Original Loan
Estimated Equity
$243,030
Purchase Details
Closed on
Jun 29, 2001
Sold by
Daniel Veronica D
Bought by
Bell Deanie M and Bell Joseph E
Home Financials for this Owner
Home Financials are based on the most recent Mortgage that was taken out on this home.
Original Mortgage
$88,301
Interest Rate
7.23%
Mortgage Type
FHA
Purchase Details
Closed on
May 17, 2000
Sold by
Daniel Veronica Denise W and Daniel Robin Ricardo
Bought by
Daniel Veronica D
Create a Home Valuation Report for This Property
The Home Valuation Report is an in-depth analysis detailing your home's value as well as a comparison with similar homes in the area
Home Values in the Area
Average Home Value in this Area
Purchase History
| Date | Buyer | Sale Price | Title Company |
|---|---|---|---|
| Bell Jerome | -- | None Available | |
| Bell Joseph E | -- | None Available | |
| Bell Deanie M | $89,000 | Saturn & Mazer Title Svcs In | |
| Daniel Veronica D | -- | -- |
Source: Public Records
Mortgage History
| Date | Status | Borrower | Loan Amount |
|---|---|---|---|
| Open | Bell Joseph E | $83,200 | |
| Closed | Bell Deanie M | $88,301 | |
| Closed | Bell Deanie M | $3,532 |
Source: Public Records
Tax History Compared to Growth
Tax History
| Year | Tax Paid | Tax Assessment Tax Assessment Total Assessment is a certain percentage of the fair market value that is determined by local assessors to be the total taxable value of land and additions on the property. | Land | Improvement |
|---|---|---|---|---|
| 2024 | $1,503 | $46,200 | $14,250 | $31,950 |
| 2023 | $1,503 | $46,200 | $14,250 | $31,950 |
| 2022 | $1,503 | $46,200 | $14,250 | $31,950 |
| 2021 | $1,519 | $46,200 | $14,250 | $31,950 |
| 2020 | $1,109 | $29,275 | $6,250 | $23,025 |
| 2019 | $807 | $29,275 | $6,250 | $23,025 |
| 2018 | $807 | $29,275 | $6,250 | $23,025 |
| 2017 | $807 | $29,275 | $6,250 | $23,025 |
| 2016 | $869 | $22,150 | $5,000 | $17,150 |
| 2015 | $869 | $22,150 | $5,000 | $17,150 |
| 2014 | $869 | $22,150 | $5,000 | $17,150 |
Source: Public Records
Map
Nearby Homes
- 3116 Lauren Evelyn Way
- 3136 Lauren Evelyn Way
- 116 Tiger Cir
- 3313 Leondale Terrace
- 3253 Rainwood Dr
- 3172 Lauren Evelyn Way
- 413 Vailview Dr
- 3247 Masonwood Dr
- 3240 Doverside Dr
- 4348 Skyridge Dr
- 3225 Sennadale Ln
- 4325 Skyridge Dr
- 3229 Moorewood Dr
- 393 Oakview Dr
- 4683 Ridge Bend Dr
- 4137 Walnut Ridge Dr
- 4125 Walnut Ridge Dr
- 4105 Walnut Ridge Dr
- 318 Homestead Rd
- 4440 Skyridge Dr
- 3709 Chesapeake Dr
- 3320 Eaglewood Ln
- 3705 Chesapeake Dr
- 3712 Chesapeake Dr
- 3316 Eaglewood Ln
- 3708 Chesapeake Dr
- 3321 Eaglewood Ln
- 204 Trailway Cir
- 3312 Eaglewood Ln
- 3701 Chesapeake Dr
- 3704 Chesapeake Dr
- 3204 Rainwood Dr
- 208 Trailway Cir
- 3317 Eaglewood Ln
- 3205 Rainwood Dr
- 3700 Chesapeake Dr
- 3208 Rainwood Dr
- 3313 Eaglewood Ln
- 3308 Eaglewood Ln
- 3209 Rainwood Dr