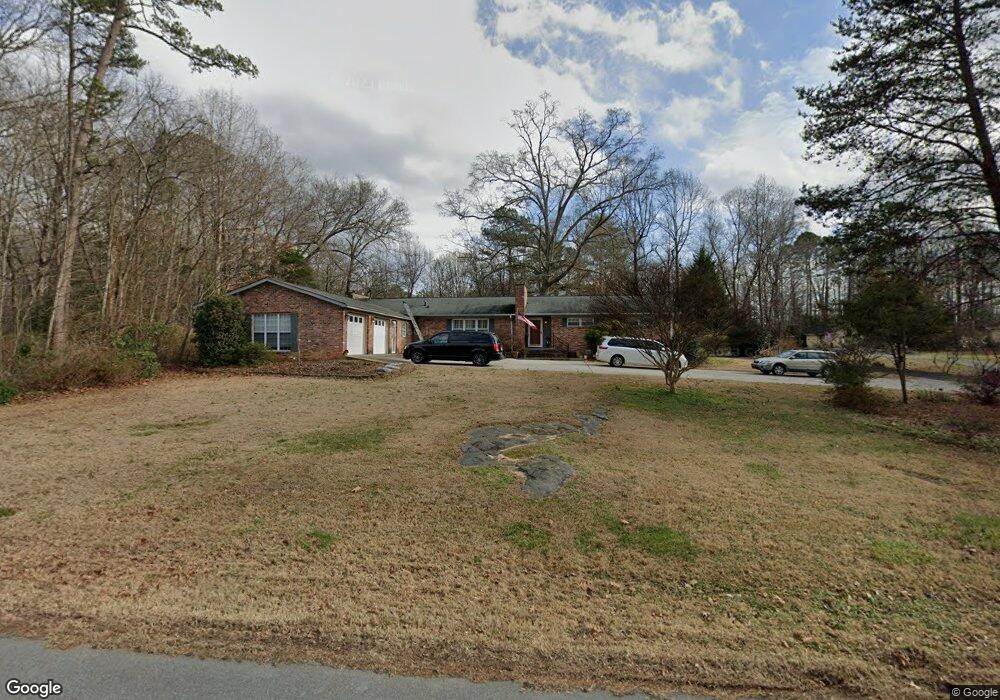
3716 Bellevue Terrace Gastonia, NC 28056
Estimated Value: $391,000 - $505,000
3
Beds
3
Baths
2,726
Sq Ft
$162/Sq Ft
Est. Value
About This Home
This home is located at 3716 Bellevue Terrace, Gastonia, NC 28056 and is currently estimated at $440,471, approximately $161 per square foot. 3716 Bellevue Terrace is a home located in Gaston County with nearby schools including New Hope Elementary School, Cramerton Middle School, and Forestview High School.
Ownership History
Date
Name
Owned For
Owner Type
Purchase Details
Closed on
Aug 13, 2020
Sold by
Shepard Megan
Bought by
Shepard Miles
Current Estimated Value
Home Financials for this Owner
Home Financials are based on the most recent Mortgage that was taken out on this home.
Original Mortgage
$212,112
Outstanding Balance
$188,158
Interest Rate
3%
Mortgage Type
VA
Estimated Equity
$252,313
Purchase Details
Closed on
Aug 10, 2020
Sold by
Shepard Miles
Bought by
Shepard Miles and Hamrick Jordan Elizabeth
Home Financials for this Owner
Home Financials are based on the most recent Mortgage that was taken out on this home.
Original Mortgage
$212,112
Outstanding Balance
$188,158
Interest Rate
3%
Mortgage Type
VA
Estimated Equity
$252,313
Purchase Details
Closed on
Jan 21, 1998
Sold by
Walker Allen Laban and Walker Randy R
Bought by
Walker Allen Laban
Purchase Details
Closed on
Aug 13, 1968
Bought by
Walker Alice Overcash
Create a Home Valuation Report for This Property
The Home Valuation Report is an in-depth analysis detailing your home's value as well as a comparison with similar homes in the area
Home Values in the Area
Average Home Value in this Area
Purchase History
| Date | Buyer | Sale Price | Title Company |
|---|---|---|---|
| Shepard Miles | -- | Elevated Natl Setmnt Svcs | |
| Shepard Miles | -- | Elevated Natl Setmnt Svcs | |
| Walker Allen Laban | -- | -- | |
| Walker Alice Overcash | -- | -- |
Source: Public Records
Mortgage History
| Date | Status | Borrower | Loan Amount |
|---|---|---|---|
| Open | Shepard Miles | $212,112 |
Source: Public Records
Tax History Compared to Growth
Tax History
| Year | Tax Paid | Tax Assessment Tax Assessment Total Assessment is a certain percentage of the fair market value that is determined by local assessors to be the total taxable value of land and additions on the property. | Land | Improvement |
|---|---|---|---|---|
| 2025 | $4,068 | $380,550 | $33,750 | $346,800 |
| 2024 | $4,068 | $380,550 | $33,750 | $346,800 |
| 2023 | $4,110 | $380,550 | $33,750 | $346,800 |
| 2022 | $2,704 | $203,320 | $29,080 | $174,240 |
| 2021 | $2,745 | $203,320 | $29,080 | $174,240 |
| 2019 | $2,765 | $203,320 | $29,080 | $174,240 |
| 2018 | $2,046 | $146,159 | $24,000 | $122,159 |
| 2017 | $2,046 | $146,159 | $24,000 | $122,159 |
| 2016 | $2,046 | $146,159 | $0 | $0 |
| 2014 | $2,492 | $177,973 | $45,000 | $132,973 |
Source: Public Records
Map
Nearby Homes
- 3608 Cramer Creek Dr
- 3454 Austin Duncan Dr
- Hayden Plan at Cramer Estates
- 4001 Cramer Estates Ct
- Galen Plan at Cramer Estates
- Penwell Plan at Cramer Estates
- Winston Plan at Cramer Estates
- Columbia Plan at Cramer Estates
- Belhaven Plan at Cramer Estates
- Robie Plan at Cramer Estates
- 4009 Cramer Estates Ct
- Wilmington Plan at Cramer Estates
- 3457 Austin Duncan Dr
- 3567 Cramer Creek Dr
- 3559 Cramer Creek Dr
- 4008 Cascade Dr
- 0000 Neely Grove Rd
- 4277 Timberwood Dr
- 4015 Broadview Ln
- 3917 Bighorn Way
- 3720 Bellevue Terrace
- 3712 Bellevue Terrace
- na Bellevue Terrace
- 3717 Fairlane Dr
- 3717 Bellevue Terrace
- 3721 Fairlane Dr
- 3728 Bellevue Terrace
- 3713 Fairlane Dr
- 3708 Bellevue Terrace
- 3713 Bellevue Terrace
- 3723 Fairlane Dr
- 3709 Fairlane Dr
- 3725 Bellevue Terrace
- 3730 Bellevue Terrace
- 3720 Pinecrest Dr Unit 9
- Lot 8 S Pinecrest Dr
- 3712 Pinecrest Dr
- 3721 Bellevue Terrace
- 3728 Pinecrest Dr
- 3709 Bellevue Terrace