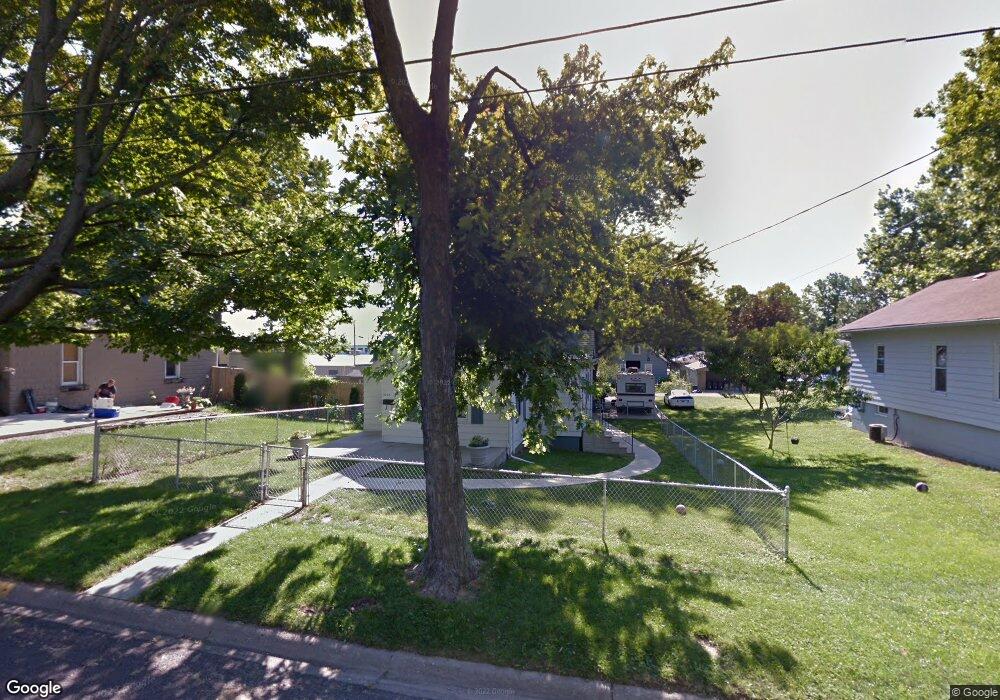
3723 N Faber Ave Peoria Heights, IL 61616
Estimated Value: $57,000 - $70,000
3
Beds
1
Bath
691
Sq Ft
$92/Sq Ft
Est. Value
About This Home
This home is located at 3723 N Faber Ave, Peoria Heights, IL 61616 and is currently estimated at $63,422, approximately $91 per square foot. 3723 N Faber Ave is a home with nearby schools including Peoria Heights Grade School, Peoria Heights High School, and St Thomas Catholic School.
Ownership History
Date
Name
Owned For
Owner Type
Purchase Details
Closed on
Jan 18, 2022
Sold by
Williams Teresa L
Bought by
Williams Teresa L and Williams Dillon Parker
Current Estimated Value
Home Financials for this Owner
Home Financials are based on the most recent Mortgage that was taken out on this home.
Original Mortgage
$37,900
Outstanding Balance
$34,849
Interest Rate
3.09%
Mortgage Type
New Conventional
Estimated Equity
$28,573
Purchase Details
Closed on
Dec 16, 2021
Sold by
Bundren Kenneth L and Bundren Daniel J
Bought by
Williams Teresa L
Home Financials for this Owner
Home Financials are based on the most recent Mortgage that was taken out on this home.
Original Mortgage
$37,900
Outstanding Balance
$34,849
Interest Rate
3.09%
Mortgage Type
New Conventional
Estimated Equity
$28,573
Purchase Details
Closed on
Sep 29, 2021
Sold by
Bundren Kenneth L
Bought by
Bundren Kenneth L and Bundren Daniel J
Purchase Details
Closed on
Dec 5, 2000
Bought by
Bundren Kenneth L
Create a Home Valuation Report for This Property
The Home Valuation Report is an in-depth analysis detailing your home's value as well as a comparison with similar homes in the area
Home Values in the Area
Average Home Value in this Area
Purchase History
| Date | Buyer | Sale Price | Title Company |
|---|---|---|---|
| Williams Teresa L | -- | None Listed On Document | |
| Williams Teresa L | $42,000 | Elias Meginnes & Seghetti Pc | |
| Bundren Kenneth L | -- | Jim Rochford And Associates | |
| Bundren Kenneth L | -- | Jim Rochford And Associates | |
| Bundren Kenneth L | $10,000 | -- |
Source: Public Records
Mortgage History
| Date | Status | Borrower | Loan Amount |
|---|---|---|---|
| Open | Williams Teresa L | $37,900 | |
| Closed | Williams Teresa L | $6,000 |
Source: Public Records
Tax History Compared to Growth
Tax History
| Year | Tax Paid | Tax Assessment Tax Assessment Total Assessment is a certain percentage of the fair market value that is determined by local assessors to be the total taxable value of land and additions on the property. | Land | Improvement |
|---|---|---|---|---|
| 2024 | $1,411 | $16,520 | $4,260 | $12,260 |
| 2023 | $1,358 | $15,160 | $3,910 | $11,250 |
| 2022 | $1,347 | $14,680 | $4,110 | $10,570 |
| 2021 | $1,441 | $15,430 | $3,910 | $11,520 |
| 2020 | $1,472 | $15,120 | $3,830 | $11,290 |
| 2019 | $1,466 | $15,120 | $3,830 | $11,290 |
| 2018 | $1,412 | $14,660 | $3,710 | $10,950 |
| 2017 | $1,432 | $14,960 | $3,790 | $11,170 |
| 2016 | $1,403 | $14,960 | $3,790 | $11,170 |
| 2015 | $1,578 | $14,960 | $3,790 | $11,170 |
| 2014 | $1,596 | $17,000 | $3,650 | $13,350 |
| 2013 | -- | $17,090 | $3,670 | $13,420 |
Source: Public Records
Map
Nearby Homes
- 512 E Paris Ave
- 1012 E Paris Ave
- 3923 N Illinois Ave
- 4100 N Illinois Ave
- 1216 E Rouse Ave
- 4012 N Boulevard Ave
- 1312 E Wilson Ave
- 4021 N Boulevard Ave
- 3824 N Dayton Ave
- 903 E Lake Ave
- 1411 E Tripp Ave Unit 2
- 810 E Sciota Ave
- 1601 E London Ave
- 1410 E Fairoaks Ave
- 1010 E Moneta Ave
- 915 E Elmhurst Ave
- 0 E Moneta Ave
- 1224 E Moneta Ave
- 1015 E Moneta Ave
- 909 E Moneta Ave
- 3719 N Faber Ave
- 3727 N Faber Ave
- 3717 N Faber Ave
- 3724 N Monroe Ave
- 3729 N Faber Ave
- 3726 N Monroe Ave
- 3728 N Monroe Ave
- 3732 N Monroe Ave
- 3805 N Faber Ave
- 3718 N Faber Ave
- 3726 N Faber Ave
- 3804 N Monroe Ave
- 3732 N Faber Ave
- 3714 N Faber Ave
- 3710 N Faber Ave
- 3807 N Faber Ave
- 3808 N Monroe Ave
- 3804 N Faber Ave
- Lot 209-21 N Faber
- Lot 209-210 N Faber Ave