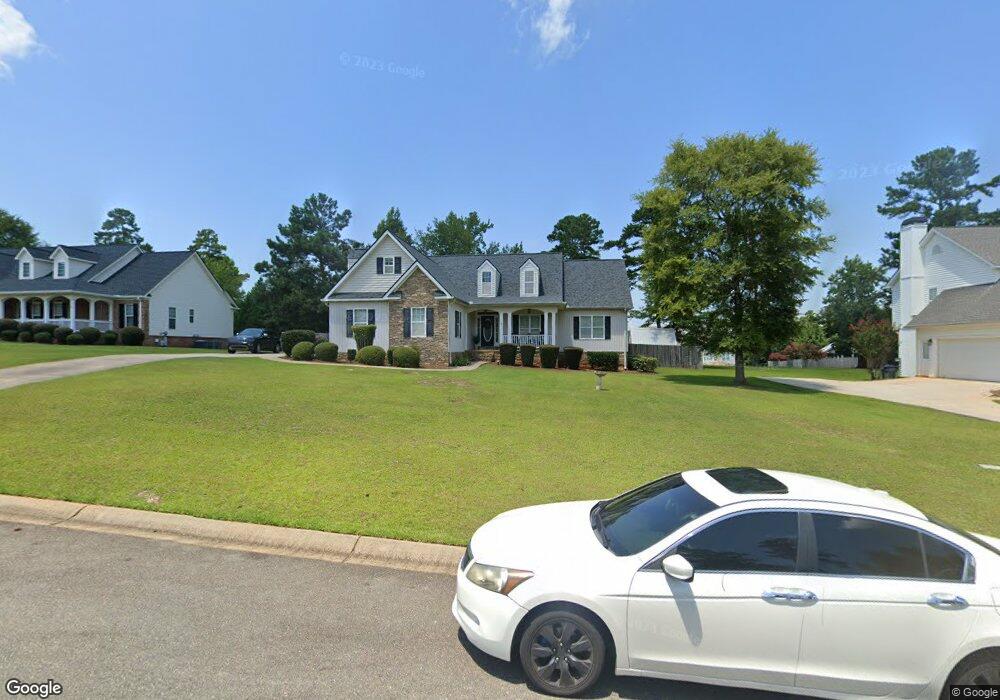
373 Emily Cir NW Milledgeville, GA 31061
Estimated Value: $314,674 - $362,000
4
Beds
2
Baths
2,492
Sq Ft
$136/Sq Ft
Est. Value
About This Home
This home is located at 373 Emily Cir NW, Milledgeville, GA 31061 and is currently estimated at $339,419, approximately $136 per square foot. 373 Emily Cir NW is a home located in Baldwin County with nearby schools including Lakeview Primary, Lakeview Academy, and Oak Hill Middle School.
Ownership History
Date
Name
Owned For
Owner Type
Purchase Details
Closed on
Oct 21, 2019
Sold by
Carrington Mtg Svcs Llc
Bought by
Tran Austin M
Current Estimated Value
Purchase Details
Closed on
Aug 6, 2019
Sold by
Jones Brenda
Bought by
Carrington Mtg Svcs Llc
Purchase Details
Closed on
Sep 18, 2008
Sold by
Dye Denton L
Bought by
Jones Ricky A and Jones Brenda
Purchase Details
Closed on
Sep 29, 2006
Sold by
Smith Elizabeth N
Bought by
Dye Denton L and Dye Mary Elizabeth
Home Financials for this Owner
Home Financials are based on the most recent Mortgage that was taken out on this home.
Original Mortgage
$40,600
Interest Rate
6.36%
Mortgage Type
New Conventional
Purchase Details
Closed on
Mar 1, 2006
Sold by
Robinson Bruce W
Bought by
Smith Elizabeth N
Home Financials for this Owner
Home Financials are based on the most recent Mortgage that was taken out on this home.
Original Mortgage
$149,900
Interest Rate
6.19%
Mortgage Type
New Conventional
Purchase Details
Closed on
Sep 20, 2005
Sold by
Meriwether Road Llc
Bought by
Robinson Bruce W
Create a Home Valuation Report for This Property
The Home Valuation Report is an in-depth analysis detailing your home's value as well as a comparison with similar homes in the area
Home Values in the Area
Average Home Value in this Area
Purchase History
| Date | Buyer | Sale Price | Title Company |
|---|---|---|---|
| Tran Austin M | $137,713 | -- | |
| Carrington Mtg Svcs Llc | $142,065 | -- | |
| Jones Ricky A | $220,000 | -- | |
| Dye Denton L | $203,000 | -- | |
| Smith Elizabeth N | $209,900 | -- | |
| Robinson Bruce W | $69,800 | -- |
Source: Public Records
Mortgage History
| Date | Status | Borrower | Loan Amount |
|---|---|---|---|
| Previous Owner | Dye Denton L | $40,600 | |
| Previous Owner | Smith Elizabeth N | $149,900 | |
| Closed | Robinson Bruce W | $0 |
Source: Public Records
Tax History Compared to Growth
Tax History
| Year | Tax Paid | Tax Assessment Tax Assessment Total Assessment is a certain percentage of the fair market value that is determined by local assessors to be the total taxable value of land and additions on the property. | Land | Improvement |
|---|---|---|---|---|
| 2025 | $2,610 | $107,088 | $9,600 | $97,488 |
| 2024 | $2,610 | $107,088 | $9,600 | $97,488 |
| 2023 | $2,064 | $82,904 | $8,000 | $74,904 |
| 2022 | $2,064 | $83,676 | $8,000 | $75,676 |
| 2021 | $1,744 | $66,640 | $8,000 | $58,640 |
| 2020 | $1,426 | $55,080 | $6,600 | $48,480 |
| 2019 | $1,723 | $66,640 | $8,000 | $58,640 |
| 2018 | $1,732 | $66,640 | $8,000 | $58,640 |
| 2017 | $1,597 | $62,640 | $4,000 | $58,640 |
| 2016 | $1,671 | $62,080 | $9,440 | $52,640 |
| 2015 | $1,674 | $62,080 | $9,440 | $52,640 |
| 2014 | $1,676 | $62,080 | $9,440 | $52,640 |
Source: Public Records
Map
Nearby Homes
- 161 Emily Cir NW
- 171 Will Place
- 171 Will Place Unit 46
- 327 High Point Trail NW
- 473 Riley Cir NW
- 465 Riley Cir NW
- 457 Riley Cir NW
- 157 Oakwood Dr NW
- 441 Riley Cir NW
- 437 Riley Cir NW
- 433 Riley Cir NW
- 479 High Point Rd
- 429 Riley Cir NW
- 145 Red Oak Trail NW Unit LOT 116
- 398 Riley Cir NW
- 124 Pin Oak Trail NW Unit LOT 97
- 134 Pin Oak Trail NW Unit LOT 94
- 403 Emily Cir NW
- 351 Emily Cir NW
- 0 Emily Cir Unit 30 8366132
- 0 Emily Cir Unit 29 8366129
- 0 Emily Cir Unit 7066740
- 0 Emily Cir Unit 7633028
- 0 Emily Cir Unit 8006307
- 0 Emily Cir Unit 8274568
- 0 Emily Cir Unit 8413473
- 0 Emily Cir Unit 8515992
- 0 Emily Cir Unit 8515993
- 222 Emily Cir NW
- 0 Emily Cir NW Unit 7048749
- 0 Emily Cir NW Unit 2964886
- 0 Emily Cir NW
- 279 Emily Cir NW
- 145 Emily Cir NW
- 179 Emily Cir NW
- 423 Emily Cir NW
- 370 Emily Cir NW