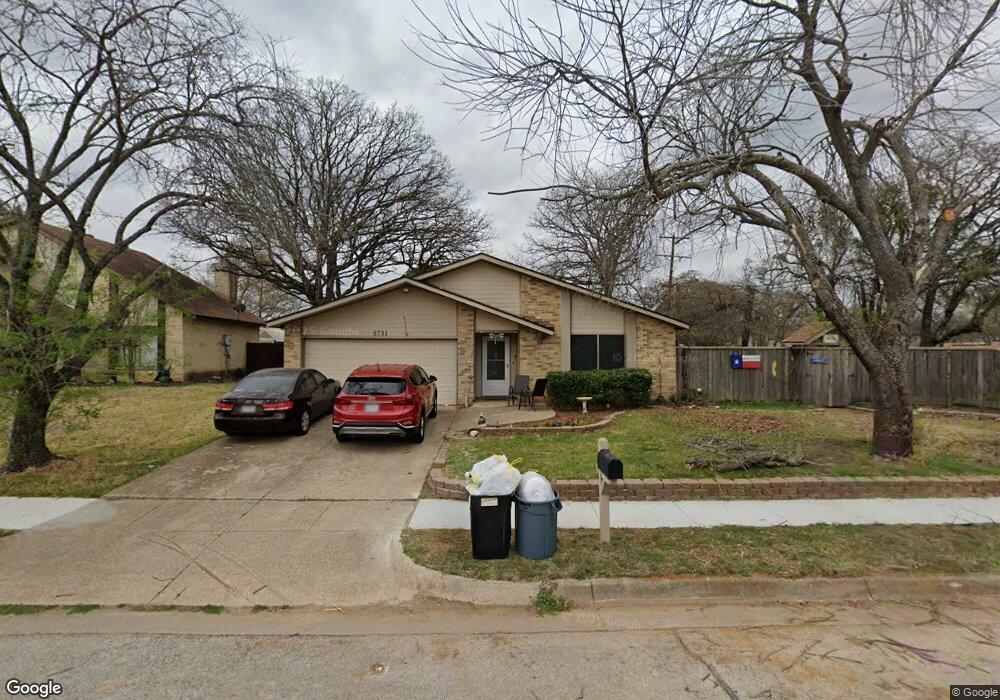
3731 Pecan Cir Bedford, TX 76021
Estimated Value: $353,797 - $381,000
3
Beds
2
Baths
1,550
Sq Ft
$234/Sq Ft
Est. Value
About This Home
This home is located at 3731 Pecan Cir, Bedford, TX 76021 and is currently estimated at $361,949, approximately $233 per square foot. 3731 Pecan Cir is a home located in Tarrant County with nearby schools including Meadow Creek Elementary School, Harwood Junior High School, and Trinity High School.
Ownership History
Date
Name
Owned For
Owner Type
Purchase Details
Closed on
Apr 17, 2018
Sold by
Allis Kymberly
Bought by
Carpenter Jimmie G and Carpenter Abbie N
Current Estimated Value
Home Financials for this Owner
Home Financials are based on the most recent Mortgage that was taken out on this home.
Original Mortgage
$216,997
Outstanding Balance
$187,937
Interest Rate
4.75%
Mortgage Type
FHA
Estimated Equity
$174,012
Purchase Details
Closed on
Dec 22, 2006
Sold by
Travis Randall E
Bought by
Allis Kymberly
Home Financials for this Owner
Home Financials are based on the most recent Mortgage that was taken out on this home.
Original Mortgage
$109,120
Interest Rate
6.27%
Mortgage Type
Purchase Money Mortgage
Purchase Details
Closed on
Feb 13, 1998
Sold by
Anderson Williamh and Anderson Dorothy Imogene
Bought by
Travis Randall E
Home Financials for this Owner
Home Financials are based on the most recent Mortgage that was taken out on this home.
Original Mortgage
$60,000
Interest Rate
7.02%
Mortgage Type
Seller Take Back
Create a Home Valuation Report for This Property
The Home Valuation Report is an in-depth analysis detailing your home's value as well as a comparison with similar homes in the area
Home Values in the Area
Average Home Value in this Area
Purchase History
| Date | Buyer | Sale Price | Title Company |
|---|---|---|---|
| Carpenter Jimmie G | -- | None Available | |
| Allis Kymberly | -- | Commonwealth Land | |
| Travis Randall E | -- | -- |
Source: Public Records
Mortgage History
| Date | Status | Borrower | Loan Amount |
|---|---|---|---|
| Open | Carpenter Jimmie G | $216,997 | |
| Previous Owner | Allis Kymberly | $109,120 | |
| Previous Owner | Travis Randall E | $60,000 |
Source: Public Records
Tax History Compared to Growth
Tax History
| Year | Tax Paid | Tax Assessment Tax Assessment Total Assessment is a certain percentage of the fair market value that is determined by local assessors to be the total taxable value of land and additions on the property. | Land | Improvement |
|---|---|---|---|---|
| 2025 | $3,231 | $335,000 | $75,000 | $260,000 |
| 2024 | $3,231 | $335,000 | $75,000 | $260,000 |
| 2023 | $6,330 | $368,468 | $45,000 | $323,468 |
| 2022 | $6,553 | $308,867 | $45,000 | $263,867 |
| 2021 | $6,425 | $289,666 | $45,000 | $244,666 |
| 2020 | $5,895 | $247,946 | $45,000 | $202,946 |
| 2019 | $5,902 | $242,926 | $45,000 | $197,926 |
| 2018 | $4,584 | $204,428 | $45,000 | $159,428 |
| 2017 | $4,552 | $214,937 | $30,000 | $184,937 |
| 2016 | $4,138 | $178,330 | $30,000 | $148,330 |
| 2015 | $3,630 | $155,500 | $18,000 | $137,500 |
| 2014 | $3,630 | $155,500 | $18,000 | $137,500 |
Source: Public Records
Map
Nearby Homes
- 3909 Allendale St
- 3013 Bent Tree Ln
- 3713 Teal Ln
- 3816 Rolling Meadows Dr
- 4001 Fairmont Ct
- 2904 Hickory Hill St
- 3405 Scenic Hills Dr
- 2904 Hickory Hill Ln
- 3112 Hazlewood Ct
- 3017 Bluebonnet Ln
- 3024 Pecan Cir
- 2609 Talisman Ct
- 3409 Langley Hill Ln
- 4300 Eaton Cir
- 3721 Fieldcrest Ln
- 3409 Crescent Ct
- 3001 Glenwood Ct
- Seaberry II Plan at Grace Park - Signature Series
- Primrose FE V Plan at Grace Park - Signature Series
- Hawthorne Plan at Grace Park - Signature Series
- 3727 Pecan Cir
- 3728 Windsong Ln
- 3724 Windsong Ln
- 3723 Pecan Cir
- 3728 Pecan Cir
- 3720 Windsong Ln
- 3724 Pecan Cir
- 3719 Pecan Cir
- 2904 Scarborough Ln W
- 3720 Pecan Cir
- 3716 Windsong Ln
- 2901 Windstone Ct
- 3725 Windsong Ln
- 3716 Pecan Cir
- 3721 Windsong Ln
- 3715 Pecan Cir
- 2905 Windstone Ct
- 2902 Scarborough Ln W
- 2900 Windstone Ct
- 3712 Windsong Ln