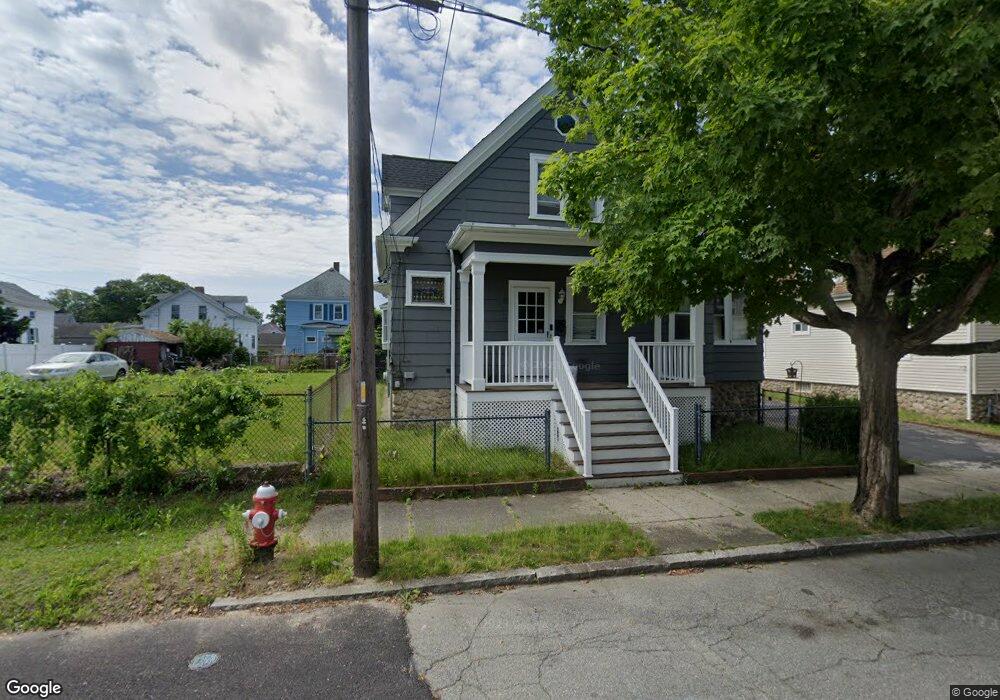
374 Farm St New Bedford, MA 02740
Downtown New Bedford NeighborhoodEstimated Value: $431,025 - $507,000
3
Beds
2
Baths
1,851
Sq Ft
$256/Sq Ft
Est. Value
About This Home
This home is located at 374 Farm St, New Bedford, MA 02740 and is currently estimated at $473,756, approximately $255 per square foot. 374 Farm St is a home located in Bristol County with nearby schools including Betsey B. Winslow Elementary School, Keith Middle School, and New Bedford High School.
Ownership History
Date
Name
Owned For
Owner Type
Purchase Details
Closed on
Dec 15, 2009
Sold by
Hollis Joanne L and Ponte Cheryl A
Bought by
Ponte David S
Current Estimated Value
Home Financials for this Owner
Home Financials are based on the most recent Mortgage that was taken out on this home.
Original Mortgage
$100,000
Outstanding Balance
$65,363
Interest Rate
5.02%
Mortgage Type
Purchase Money Mortgage
Estimated Equity
$408,393
Purchase Details
Closed on
Aug 21, 2008
Sold by
Ponte Lionel E
Bought by
Ponte Cheryl A and Ponte David S
Create a Home Valuation Report for This Property
The Home Valuation Report is an in-depth analysis detailing your home's value as well as a comparison with similar homes in the area
Home Values in the Area
Average Home Value in this Area
Purchase History
| Date | Buyer | Sale Price | Title Company |
|---|---|---|---|
| Ponte David S | -- | -- | |
| Ponte David S | -- | -- | |
| Ponte Cheryl A | -- | -- | |
| Ponte Cheryl A | -- | -- |
Source: Public Records
Mortgage History
| Date | Status | Borrower | Loan Amount |
|---|---|---|---|
| Open | Ponte Cheryl A | $100,000 | |
| Closed | Ponte Cheryl A | $100,000 |
Source: Public Records
Tax History Compared to Growth
Tax History
| Year | Tax Paid | Tax Assessment Tax Assessment Total Assessment is a certain percentage of the fair market value that is determined by local assessors to be the total taxable value of land and additions on the property. | Land | Improvement |
|---|---|---|---|---|
| 2025 | $3,981 | $352,000 | $110,900 | $241,100 |
| 2024 | $4,063 | $338,600 | $105,700 | $232,900 |
| 2023 | $3,747 | $262,200 | $94,600 | $167,600 |
| 2022 | $3,582 | $230,500 | $90,100 | $140,400 |
| 2021 | $3,491 | $223,900 | $90,100 | $133,800 |
| 2020 | $3,644 | $225,500 | $93,600 | $131,900 |
| 2019 | $3,627 | $220,200 | $95,300 | $124,900 |
| 2018 | $3,537 | $212,700 | $95,300 | $117,400 |
| 2017 | $3,411 | $204,400 | $95,300 | $109,100 |
| 2016 | $3,529 | $214,000 | $90,100 | $123,900 |
| 2015 | $3,344 | $212,600 | $93,600 | $119,000 |
| 2014 | $3,212 | $211,900 | $95,300 | $116,600 |
Source: Public Records
Map
Nearby Homes
- 382 Farm St
- 473 Allen St
- 368 Farm St
- 467 Allen St
- 392 Farm St
- 463 Allen St
- 375 Farm St
- 383 Farm St Unit 385
- 459 Allen St
- 389 Farm St Unit 391
- 361 Farm St
- 389-391 Farm St
- 485 Allen St
- 487 Allen St
- 357 Farm St Unit 359
- 395 Farm St Unit 397
- 453 Allen St
- 374 Bedford St Unit 376
- 378 Bedford St Unit 380
- 472 Allen St