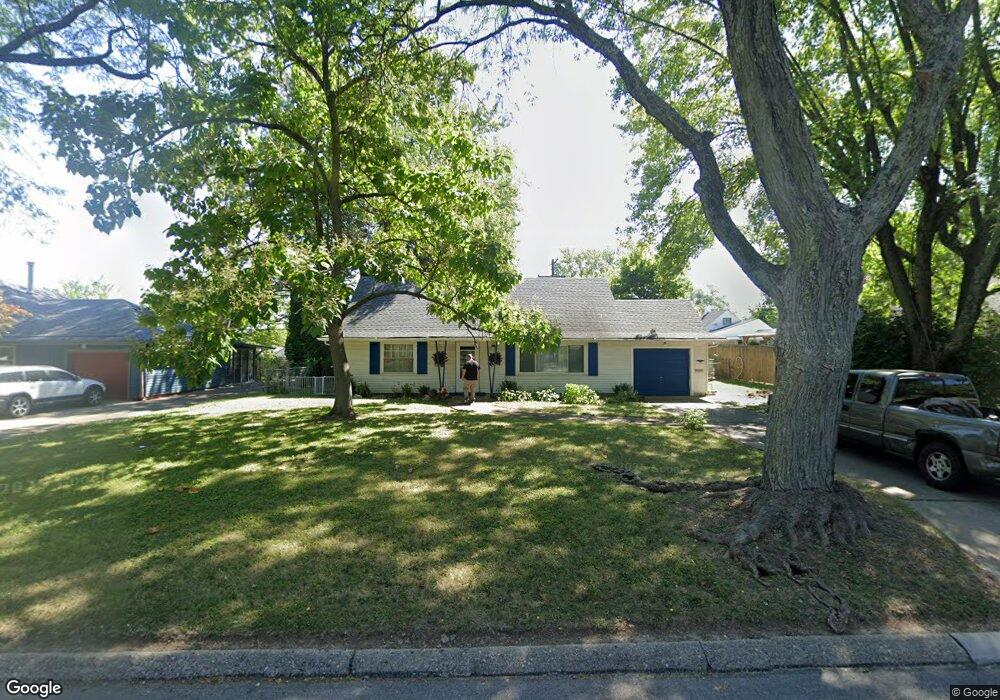
3744 Ackerman Blvd Dayton, OH 45429
Estimated Value: $182,000 - $205,000
2
Beds
1
Bath
1,066
Sq Ft
$181/Sq Ft
Est. Value
About This Home
This home is located at 3744 Ackerman Blvd, Dayton, OH 45429 and is currently estimated at $192,664, approximately $180 per square foot. 3744 Ackerman Blvd is a home located in Montgomery County with nearby schools including Oakview Elementary School, Van Buren Middle School, and Kettering Fairmont High School.
Ownership History
Date
Name
Owned For
Owner Type
Purchase Details
Closed on
Jul 22, 2024
Sold by
Dineen John J and Dineen Mary K
Bought by
John And Mary Dineen Revocable Trust and Dineen
Current Estimated Value
Purchase Details
Closed on
Aug 28, 2003
Sold by
U S Bank Na
Bought by
Dineen John and Dineen Mary
Home Financials for this Owner
Home Financials are based on the most recent Mortgage that was taken out on this home.
Original Mortgage
$44,000
Interest Rate
6.18%
Mortgage Type
Purchase Money Mortgage
Purchase Details
Closed on
Jul 25, 2003
Sold by
Jones Sylvia A
Bought by
U S Bank Na and Star Bank Na
Home Financials for this Owner
Home Financials are based on the most recent Mortgage that was taken out on this home.
Original Mortgage
$44,000
Interest Rate
6.18%
Mortgage Type
Purchase Money Mortgage
Purchase Details
Closed on
Jan 5, 1995
Sold by
Bruns Ralph Bernard
Bought by
Jones Sylvia A
Create a Home Valuation Report for This Property
The Home Valuation Report is an in-depth analysis detailing your home's value as well as a comparison with similar homes in the area
Home Values in the Area
Average Home Value in this Area
Purchase History
| Date | Buyer | Sale Price | Title Company |
|---|---|---|---|
| John And Mary Dineen Revocable Trust | -- | None Listed On Document | |
| Dineen John | $74,000 | Landmark Title Agency Inc So | |
| U S Bank Na | $71,000 | -- | |
| Jones Sylvia A | $75,000 | -- |
Source: Public Records
Mortgage History
| Date | Status | Borrower | Loan Amount |
|---|---|---|---|
| Previous Owner | Dineen John | $44,000 |
Source: Public Records
Tax History Compared to Growth
Tax History
| Year | Tax Paid | Tax Assessment Tax Assessment Total Assessment is a certain percentage of the fair market value that is determined by local assessors to be the total taxable value of land and additions on the property. | Land | Improvement |
|---|---|---|---|---|
| 2024 | $3,172 | $49,510 | $14,770 | $34,740 |
| 2023 | $3,172 | $49,510 | $14,770 | $34,740 |
| 2022 | $2,915 | $35,920 | $10,710 | $25,210 |
| 2021 | $2,703 | $35,920 | $10,710 | $25,210 |
| 2020 | $2,711 | $35,920 | $10,710 | $25,210 |
| 2019 | $2,978 | $34,960 | $10,710 | $24,250 |
| 2018 | $2,994 | $34,960 | $10,710 | $24,250 |
| 2017 | $2,767 | $34,960 | $10,710 | $24,250 |
| 2016 | $2,619 | $31,060 | $10,710 | $20,350 |
| 2015 | $2,507 | $31,060 | $10,710 | $20,350 |
| 2014 | $2,507 | $31,060 | $10,710 | $20,350 |
| 2012 | -- | $35,050 | $10,740 | $24,310 |
Source: Public Records
Map
Nearby Homes
- 855 Brookfield Rd
- 3822 Milford Dr
- 645 Brookfield Rd
- 3872 Maryknoll Dr
- 856 Timberlake Ct
- 861 Timberlake Ct
- 959 Kimberly Dr
- 604 Schuyler Dr
- 900 Garrison Ave
- 1105 Greenridge Dr
- 1013 Swango Dr
- 3200 Oakmont Ave
- 3209 Waltham Ave
- 3309 Sharon Ave
- 587 Cottingwood Ct
- 813 Rockhill Ave
- 3725 Claybourne Rd
- 791 Willowdale Ave
- 3198 Sagamon Ave Unit 13198
- 503 Cottingwood Ct
- 3736 Ackerman Blvd
- 901 Gardner Rd
- 911 Gardner Rd
- 3730 Ackerman Blvd
- 920 Wenbrook Dr
- 926 Wenbrook Dr
- 917 Gardner Rd
- 3743 Ackerman Blvd
- 900 Gardner Rd
- 3737 Ackerman Blvd
- 861 Gardner Rd
- 3724 Ackerman Blvd
- 3717 Wenbrook Dr
- 910 Gardner Rd
- 923 Gardner Rd
- 3729 Ackerman Blvd
- 925 Gardner Rd
- 932 Wenbrook Dr
- 3806 Ackerman Blvd
- 860 Gardner Rd