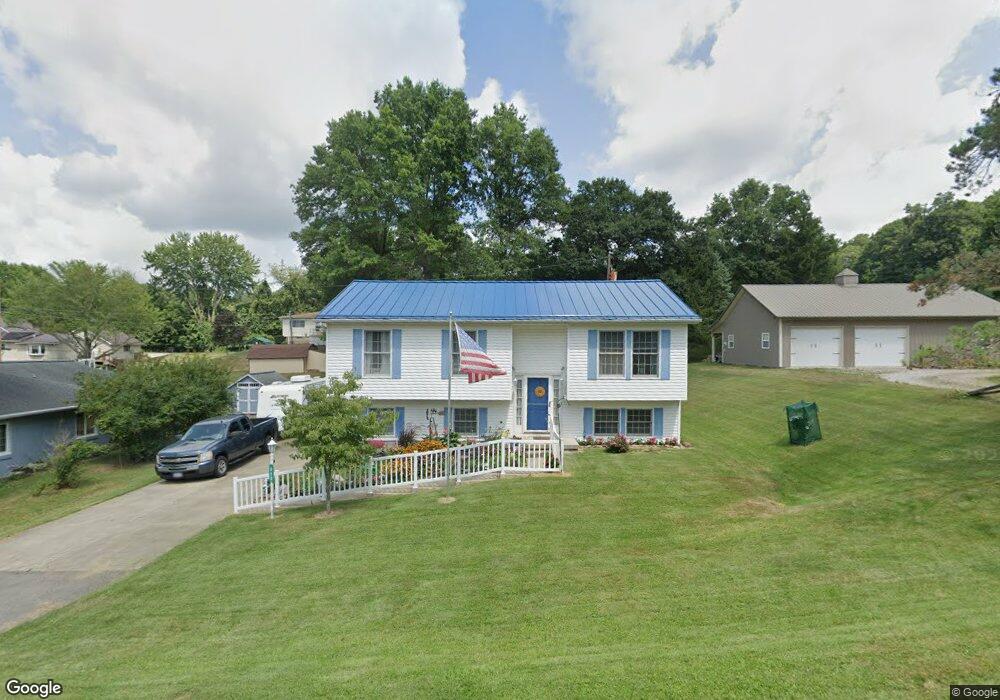
375 Greenfield Ave Lancaster, OH 43130
Estimated Value: $239,000 - $287,000
3
Beds
2
Baths
1,028
Sq Ft
$249/Sq Ft
Est. Value
About This Home
This home is located at 375 Greenfield Ave, Lancaster, OH 43130 and is currently estimated at $256,458, approximately $249 per square foot. 375 Greenfield Ave is a home located in Fairfield County with nearby schools including Tarhe Elementary School, General Sherman Junior High School, and Lancaster High School.
Ownership History
Date
Name
Owned For
Owner Type
Purchase Details
Closed on
Jun 20, 2011
Sold by
Dickson Laura R
Bought by
Hartsough Roger and Hartsough Sandy
Current Estimated Value
Purchase Details
Closed on
Feb 6, 2004
Sold by
Smith Candace T
Bought by
Dickson Gary E and Dickson Laura R
Home Financials for this Owner
Home Financials are based on the most recent Mortgage that was taken out on this home.
Original Mortgage
$73,000
Outstanding Balance
$34,356
Interest Rate
5.88%
Mortgage Type
Purchase Money Mortgage
Estimated Equity
$222,102
Purchase Details
Closed on
Apr 13, 1995
Sold by
Sheppard Thomas J
Bought by
Candace T Smith
Home Financials for this Owner
Home Financials are based on the most recent Mortgage that was taken out on this home.
Original Mortgage
$97,850
Interest Rate
8.55%
Mortgage Type
New Conventional
Purchase Details
Closed on
Aug 31, 1993
Sold by
Irwin Lawrence
Bought by
Sheppard Thomas J
Purchase Details
Closed on
Mar 1, 1989
Create a Home Valuation Report for This Property
The Home Valuation Report is an in-depth analysis detailing your home's value as well as a comparison with similar homes in the area
Home Values in the Area
Average Home Value in this Area
Purchase History
| Date | Buyer | Sale Price | Title Company |
|---|---|---|---|
| Hartsough Roger | $105,000 | Arrow Title Agency Llc | |
| Dickson Gary E | $123,000 | Valmer Land Title | |
| Candace T Smith | $103,000 | -- | |
| Sheppard Thomas J | $10,000 | -- | |
| -- | $10,000 | -- |
Source: Public Records
Mortgage History
| Date | Status | Borrower | Loan Amount |
|---|---|---|---|
| Open | Dickson Gary E | $73,000 | |
| Closed | Candace T Smith | $97,850 |
Source: Public Records
Tax History Compared to Growth
Tax History
| Year | Tax Paid | Tax Assessment Tax Assessment Total Assessment is a certain percentage of the fair market value that is determined by local assessors to be the total taxable value of land and additions on the property. | Land | Improvement |
|---|---|---|---|---|
| 2024 | $5,010 | $55,730 | $10,760 | $44,970 |
| 2023 | $1,694 | $55,730 | $10,760 | $44,970 |
| 2022 | $1,716 | $55,730 | $10,760 | $44,970 |
| 2021 | $1,406 | $44,830 | $10,760 | $34,070 |
| 2020 | $1,414 | $44,830 | $10,760 | $34,070 |
| 2019 | $1,281 | $44,830 | $10,760 | $34,070 |
| 2018 | $1,167 | $39,900 | $10,760 | $29,140 |
| 2017 | $1,168 | $39,980 | $10,760 | $29,220 |
| 2016 | $1,137 | $39,980 | $10,760 | $29,220 |
| 2015 | $1,123 | $38,670 | $10,760 | $27,910 |
| 2014 | $1,070 | $38,670 | $10,760 | $27,910 |
| 2013 | $1,070 | $38,670 | $10,760 | $27,910 |
Source: Public Records
Map
Nearby Homes
- 319 Greenfield Ave
- 0 Wacker Dr Unit 225036189
- 1700 N Columbus St
- 1511 N Columbus St
- 189 Berkeley Dr
- 0 Marks Ave Unit 225036443
- 1190 N Columbus St
- 1318 Graf St
- 260 Scott Dr
- 100 Wilson Ave
- 1125 Olds Ave
- 315 Park St
- 218 Marvel Dr
- 222 Park St
- 226 Whittier Dr S
- 1000 Goodwin Ave
- 173 Lakeview Dr NE
- 815 Beacon St
- 936 Harrison Ave
- 953 Garfield Ave
- 375 Greenfield St
- 352 Greenfield Ave
- 320 Seneca Dr
- 414 Mound St
- 424 Mound St
- 404 Mound St
- 374 Greenfield Ave
- 314 Seneca Dr
- 312 Greenfield Ave
- 415 Leonard Dr
- 321 Seneca Dr
- 352 Mound St
- 425 Leonard Dr
- 315 Seneca Dr
- 405 Leonard Dr
- 345 Greenfield Ave
- 344 Mound St
- 431 Leonard Dr
- 357 Leonard Dr
- 1620 Lookout St