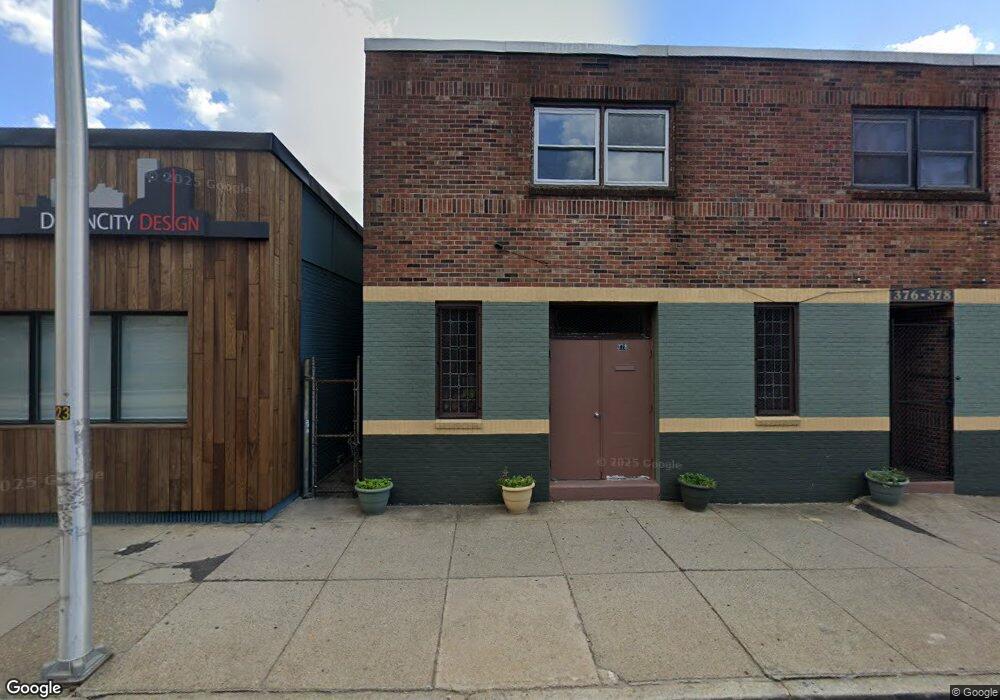
376 Cranston St Providence, RI 02907
West End NeighborhoodEstimated Value: $814,593
--
Bed
--
Bath
5,200
Sq Ft
$157/Sq Ft
Est. Value
About This Home
This home is located at 376 Cranston St, Providence, RI 02907 and is currently estimated at $814,593, approximately $156 per square foot. 376 Cranston St is a home located in Providence County with nearby schools including Asa Messer Elementary School, Charles N. Fortes Elementary School, and Alfred Lima Sr. Elementary School.
Ownership History
Date
Name
Owned For
Owner Type
Purchase Details
Closed on
Sep 11, 2018
Sold by
Choloply Roseline and Smith-Timbo Naomi
Bought by
Choloply Roseline
Current Estimated Value
Purchase Details
Closed on
Feb 1, 2010
Sold by
Crossroads Convenant I
Bought by
Smith-Timb Naomi and Choloply Roseline
Purchase Details
Closed on
Sep 11, 2007
Sold by
Choloply Roseline and Timbo Naomi
Bought by
Crossroads Covenant Ch
Purchase Details
Closed on
Jun 22, 2007
Sold by
Mission Grace and Mission Hope
Bought by
Timbo Naomi and Choloply Roseline
Home Financials for this Owner
Home Financials are based on the most recent Mortgage that was taken out on this home.
Original Mortgage
$320,000
Interest Rate
6.14%
Mortgage Type
Commercial
Create a Home Valuation Report for This Property
The Home Valuation Report is an in-depth analysis detailing your home's value as well as a comparison with similar homes in the area
Home Values in the Area
Average Home Value in this Area
Purchase History
| Date | Buyer | Sale Price | Title Company |
|---|---|---|---|
| Choloply Roseline | -- | -- | |
| Smith-Timb Naomi | -- | -- | |
| Crossroads Covenant Ch | -- | -- | |
| Timbo Naomi | $452,000 | -- |
Source: Public Records
Mortgage History
| Date | Status | Borrower | Loan Amount |
|---|---|---|---|
| Previous Owner | Timbo Naomi | $320,000 |
Source: Public Records
Tax History Compared to Growth
Tax History
| Year | Tax Paid | Tax Assessment Tax Assessment Total Assessment is a certain percentage of the fair market value that is determined by local assessors to be the total taxable value of land and additions on the property. | Land | Improvement |
|---|---|---|---|---|
| 2025 | $7,446 | $510,000 | $134,700 | $375,300 |
| 2024 | $13,549 | $386,000 | $81,600 | $304,400 |
| 2023 | $13,549 | $386,000 | $81,600 | $304,400 |
| 2022 | $13,664 | $386,000 | $81,600 | $304,400 |
| 2021 | $11,373 | $309,900 | $58,700 | $251,200 |
| 2020 | $11,373 | $309,900 | $58,700 | $251,200 |
| 2019 | $0 | $421,900 | $58,700 | $363,200 |
| 2018 | $0 | $426,200 | $53,400 | $372,800 |
| 2017 | $0 | $426,200 | $53,400 | $372,800 |
| 2016 | -- | $426,200 | $53,400 | $372,800 |
| 2015 | -- | $414,200 | $53,400 | $360,800 |
| 2014 | -- | $414,200 | $53,400 | $360,800 |
| 2013 | -- | $414,200 | $53,400 | $360,800 |
Source: Public Records
Map
Nearby Homes