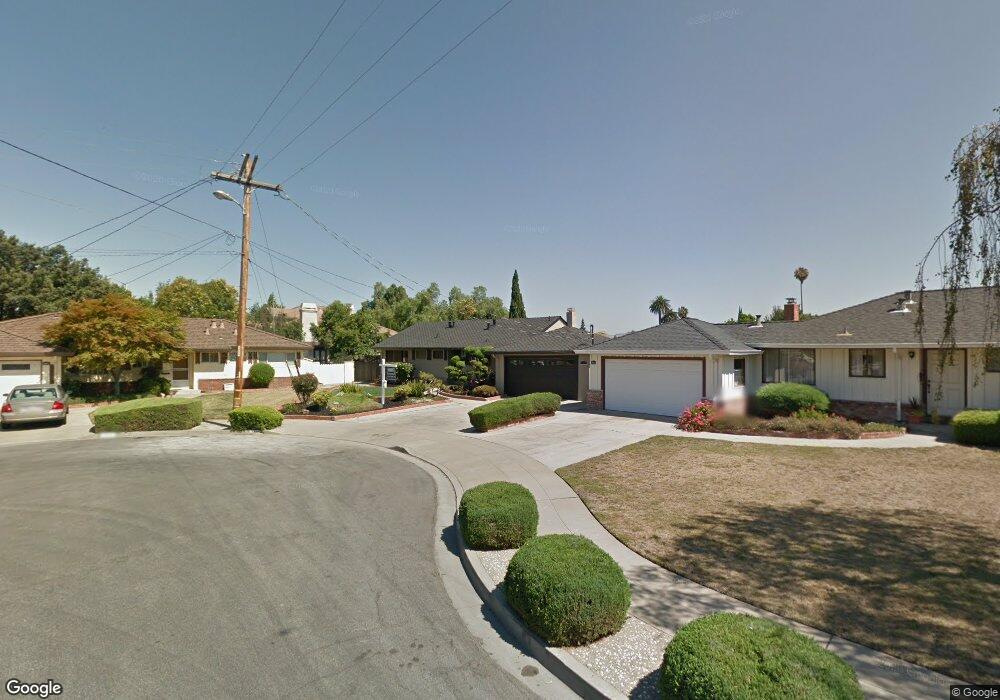
37702 Elliot St Fremont, CA 94536
Glenmoor NeighborhoodEstimated Value: $1,298,000 - $1,612,000
3
Beds
2
Baths
1,092
Sq Ft
$1,334/Sq Ft
Est. Value
About This Home
This home is located at 37702 Elliot St, Fremont, CA 94536 and is currently estimated at $1,457,255, approximately $1,334 per square foot. 37702 Elliot St is a home located in Alameda County with nearby schools including Glenmoor Elementary School, Centerville Junior High School, and Washington High School.
Ownership History
Date
Name
Owned For
Owner Type
Purchase Details
Closed on
Oct 5, 2015
Sold by
Perez Barrios Alejandrino and Patel Rakesh R
Bought by
Vengal Sudhaakar Raghuram S and Vengal Chittibabu Swetha
Current Estimated Value
Home Financials for this Owner
Home Financials are based on the most recent Mortgage that was taken out on this home.
Original Mortgage
$704,800
Outstanding Balance
$552,640
Interest Rate
3.78%
Mortgage Type
New Conventional
Estimated Equity
$904,615
Purchase Details
Closed on
May 15, 2015
Sold by
Herrera Marina
Bought by
Perez Barrios Alejandrino
Purchase Details
Closed on
May 8, 2015
Sold by
Silva Shirley M
Bought by
Perez Barrios Alejandrino and Patel Rakesh R
Purchase Details
Closed on
Sep 24, 2005
Sold by
Silva Shirley M
Bought by
The Shirley Marie Silva Living Trust
Create a Home Valuation Report for This Property
The Home Valuation Report is an in-depth analysis detailing your home's value as well as a comparison with similar homes in the area
Home Values in the Area
Average Home Value in this Area
Purchase History
| Date | Buyer | Sale Price | Title Company |
|---|---|---|---|
| Vengal Sudhaakar Raghuram S | $881,000 | Fidelity National Title Co | |
| Perez Barrios Alejandrino | -- | Fidelity National Title Co | |
| Patel Rakesh R | -- | Fidelity National Title Co | |
| Perez Barrios Alejandrino | $770,000 | Fidelity National Title Co | |
| The Shirley Marie Silva Living Trust | -- | -- |
Source: Public Records
Mortgage History
| Date | Status | Borrower | Loan Amount |
|---|---|---|---|
| Open | Vengal Sudhaakar Raghuram S | $704,800 |
Source: Public Records
Tax History Compared to Growth
Tax History
| Year | Tax Paid | Tax Assessment Tax Assessment Total Assessment is a certain percentage of the fair market value that is determined by local assessors to be the total taxable value of land and additions on the property. | Land | Improvement |
|---|---|---|---|---|
| 2025 | $12,324 | $1,035,900 | $402,481 | $640,419 |
| 2024 | $12,324 | $1,015,452 | $394,590 | $627,862 |
| 2023 | $11,998 | $1,002,410 | $386,855 | $615,555 |
| 2022 | $11,850 | $975,755 | $379,270 | $603,485 |
| 2021 | $11,556 | $956,487 | $371,834 | $591,653 |
| 2020 | $11,613 | $953,611 | $368,022 | $585,589 |
| 2019 | $11,479 | $934,917 | $360,808 | $574,109 |
| 2018 | $11,255 | $916,592 | $353,736 | $562,856 |
| 2017 | $11,054 | $898,620 | $346,800 | $551,820 |
| 2016 | $10,871 | $881,000 | $340,000 | $541,000 |
| 2015 | $1,111 | $55,284 | $18,564 | $36,720 |
| 2014 | $1,080 | $54,201 | $18,200 | $36,001 |
Source: Public Records
Map
Nearby Homes
- 37721 Madera Ct
- 4948 Norris Rd
- 37621 Glenmoor Dr
- 37792 Colfax Ct
- 37987 Alta Dr
- 4737 Deadwood Dr
- 4586 Norris Rd
- 5169 Lawler Ave
- 5268 Keeler Ct
- 38324 Blacow Rd
- 4715 Eggers Dr
- 37114 Dondero Way
- 37659 Granville Dr
- 4637 Rothbury Common
- 4754 Northdale Dr
- 4544 Thornton Ave
- 37001 Contra Costa Ave
- 36720 Charles St
- 4632 Balboa Way
- 4328 Cognina Ct
- 4947 Dowling Ave
- 37689 Los Arboles Dr
- 37718 Elliot St
- 37630 Central Cove Ct
- 37699 Los Arboles Dr
- 37679 Los Arboles Dr
- 37707 Los Arboles Dr
- 37628 Central Cove Ct
- 4967 Dowling Ave
- 37717 Los Arboles Dr
- 37734 Elliot St
- 37626 Central Cove Ct
- 37626 Central Cove Ct
- 37727 Los Arboles Dr
- 4970 Dowling Ave
- 37651 Murietta Terrace
- 37627 Central Cove Ct
- 37669 Los Arboles Dr
- 4987 Dowling Ave
- 37641 Murietta Terrace