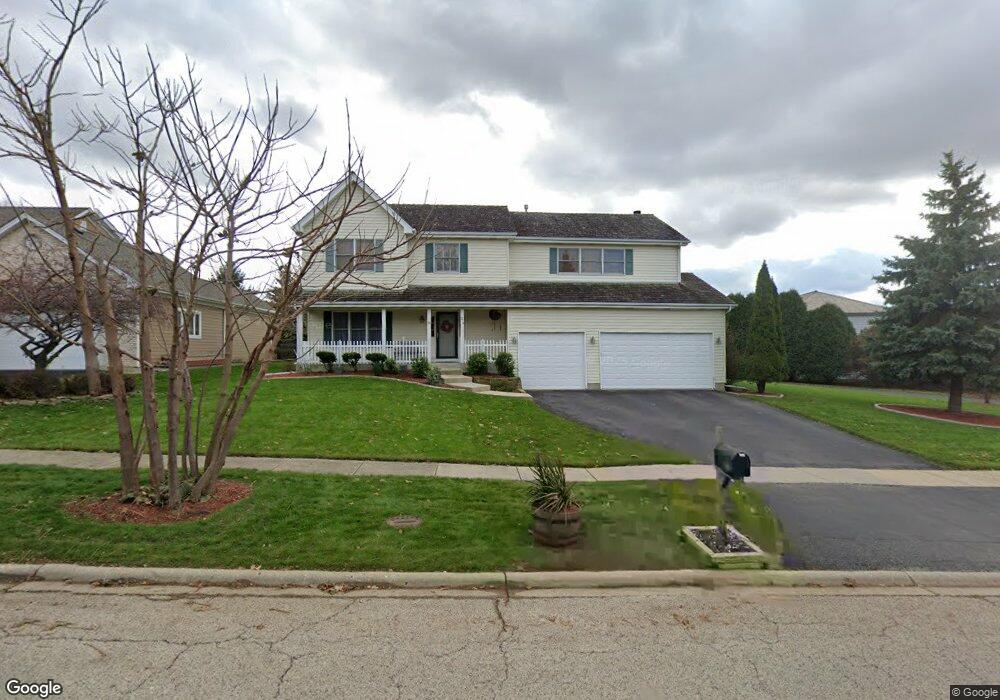
379 Kerry Way Grayslake, IL 60030
Estimated Value: $450,000 - $478,000
4
Beds
3
Baths
2,885
Sq Ft
$162/Sq Ft
Est. Value
About This Home
This home is located at 379 Kerry Way, Grayslake, IL 60030 and is currently estimated at $467,186, approximately $161 per square foot. 379 Kerry Way is a home located in Lake County with nearby schools including Woodland Primary School, Woodland Elementary School, and Woodland Intermediate School.
Ownership History
Date
Name
Owned For
Owner Type
Purchase Details
Closed on
Sep 20, 2001
Sold by
Squillo Steven T and Squillo Tiffany A
Bought by
Rhomberg Mark S and Rhomberg Tracy M
Current Estimated Value
Home Financials for this Owner
Home Financials are based on the most recent Mortgage that was taken out on this home.
Original Mortgage
$232,000
Outstanding Balance
$90,006
Interest Rate
6.92%
Estimated Equity
$377,180
Purchase Details
Closed on
Aug 25, 1999
Sold by
Penella Homes Inc
Bought by
Squillo Steven and Squillo Tiffany
Home Financials for this Owner
Home Financials are based on the most recent Mortgage that was taken out on this home.
Original Mortgage
$256,600
Interest Rate
8.37%
Purchase Details
Closed on
Sep 14, 1998
Sold by
Baar Construction Inc
Bought by
Pennella Homes Inc
Purchase Details
Closed on
Jul 19, 1994
Sold by
Grand National Bank
Bought by
Baar Construction Inc
Create a Home Valuation Report for This Property
The Home Valuation Report is an in-depth analysis detailing your home's value as well as a comparison with similar homes in the area
Home Values in the Area
Average Home Value in this Area
Purchase History
| Date | Buyer | Sale Price | Title Company |
|---|---|---|---|
| Rhomberg Mark S | $290,000 | -- | |
| Squillo Steven | $257,000 | -- | |
| Pennella Homes Inc | $87,000 | Chicago Title Insurance Co | |
| Baar Construction Inc | $39,500 | -- |
Source: Public Records
Mortgage History
| Date | Status | Borrower | Loan Amount |
|---|---|---|---|
| Open | Rhomberg Mark S | $232,000 | |
| Previous Owner | Squillo Steven | $256,600 |
Source: Public Records
Tax History Compared to Growth
Tax History
| Year | Tax Paid | Tax Assessment Tax Assessment Total Assessment is a certain percentage of the fair market value that is determined by local assessors to be the total taxable value of land and additions on the property. | Land | Improvement |
|---|---|---|---|---|
| 2024 | $10,939 | $114,965 | $18,200 | $96,765 |
| 2023 | $11,161 | $105,511 | $16,703 | $88,808 |
| 2022 | $11,161 | $105,142 | $16,321 | $88,821 |
| 2021 | $10,995 | $101,059 | $15,687 | $85,372 |
| 2020 | $12,138 | $106,004 | $14,926 | $91,078 |
| 2019 | $11,692 | $101,702 | $14,320 | $87,382 |
| 2018 | $12,482 | $109,338 | $21,123 | $88,215 |
| 2017 | $12,365 | $102,848 | $19,869 | $82,979 |
| 2016 | $11,875 | $94,939 | $18,341 | $76,598 |
| 2015 | $11,416 | $86,734 | $16,756 | $69,978 |
| 2014 | $10,383 | $77,867 | $13,589 | $64,278 |
| 2012 | $10,312 | $81,323 | $14,192 | $67,131 |
Source: Public Records
Map
Nearby Homes
- 1617 Albany St
- 1191 Hummingbird Ln
- 23 Bobolink Dr
- 1544 Portia Rd
- 390 N Garfield Blvd
- 355 Buckingham Dr
- 399 Banbury Ln
- 33276 N Sunset Ave
- 33336 N Indian Ln
- 146 Westerfield Place
- 977 Harris Rd Unit 34
- 1023 Harris Rd
- 707 Crossland Dr
- 1544 Syracuse Dr
- 18740 W Willow Point Dr
- 633 Dove Ct Unit 4
- 32381 N Forest Dr
- 121 Park Ave
- 745 Dillon Ct
- 827 Easton Ct
- 373 Kerry Way
- 389 Kerry Way
- 356 Stevens Ct
- 367 Kerry Way
- 355 Stevens Ct
- 354 Stevens Ct
- 353 Stevens Ct
- 1114 Silo Hill Dr
- 1126 Silo Hill Dr
- 351 Stevens Ct
- 352 Stevens Ct
- 1102 Silo Hill Dr
- 349 Stevens Ct
- 1138 Silo Hill Dr
- 361 Kerry Way
- 347 Stevens Ct
- 350 Stevens Ct
- 1150 Silo Hill Dr
- 345 Stevens Ct
- 340 Stevens Ct