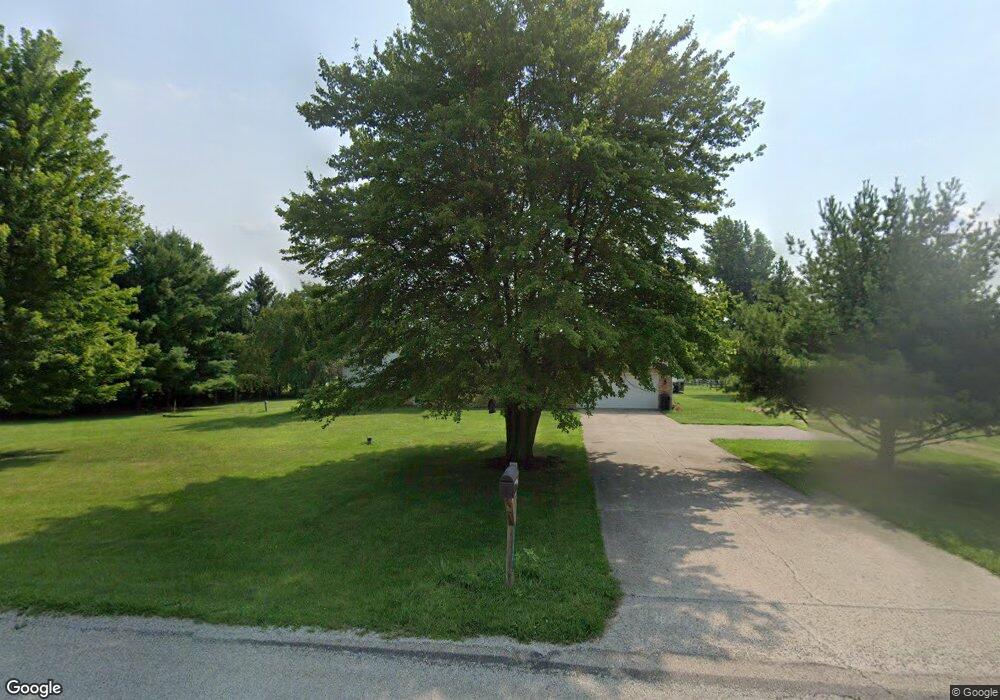
3790 Vernon-Asbury Rd South Vienna, OH 45369
Estimated Value: $338,423 - $478,000
3
Beds
2
Baths
1,652
Sq Ft
$248/Sq Ft
Est. Value
About This Home
This home is located at 3790 Vernon-Asbury Rd, South Vienna, OH 45369 and is currently estimated at $410,106, approximately $248 per square foot. 3790 Vernon-Asbury Rd is a home located in Clark County with nearby schools including Northeastern Elementary School and Northeastern Middle & High School.
Ownership History
Date
Name
Owned For
Owner Type
Purchase Details
Closed on
Sep 18, 2020
Sold by
Mann Tracy W
Bought by
Buss Jackie and Sloan Carter Ray
Current Estimated Value
Home Financials for this Owner
Home Financials are based on the most recent Mortgage that was taken out on this home.
Original Mortgage
$274,900
Outstanding Balance
$243,503
Interest Rate
2.8%
Mortgage Type
New Conventional
Estimated Equity
$166,603
Purchase Details
Closed on
Apr 21, 2020
Sold by
Estate Of Virginia Michelle Mccoy
Bought by
Mann Tracy W
Purchase Details
Closed on
Feb 11, 2013
Sold by
Mcgraw Kenneth D and Mcgraw Marcia J
Bought by
Mccoy Virginia M
Purchase Details
Closed on
Aug 8, 2007
Sold by
Pfleger Harry R and Pfleger Diana S
Bought by
Mcgraw Kenneth D and Mcgraw Marcia J
Purchase Details
Closed on
Dec 1, 1989
Sold by
Cornett Sheldon and Cornett Beverly A
Bought by
Pfleger Harry R and Pfleger Diana S
Create a Home Valuation Report for This Property
The Home Valuation Report is an in-depth analysis detailing your home's value as well as a comparison with similar homes in the area
Home Values in the Area
Average Home Value in this Area
Purchase History
| Date | Buyer | Sale Price | Title Company |
|---|---|---|---|
| Buss Jackie | $284,900 | Midland Title West | |
| Mann Tracy W | -- | City Title Agency | |
| Mccoy Virginia M | $1,650,000 | None Available | |
| Mcgraw Kenneth D | $185,900 | None Available | |
| Pfleger Harry R | $88,900 | -- |
Source: Public Records
Mortgage History
| Date | Status | Borrower | Loan Amount |
|---|---|---|---|
| Open | Buss Jackie | $274,900 |
Source: Public Records
Tax History Compared to Growth
Tax History
| Year | Tax Paid | Tax Assessment Tax Assessment Total Assessment is a certain percentage of the fair market value that is determined by local assessors to be the total taxable value of land and additions on the property. | Land | Improvement |
|---|---|---|---|---|
| 2024 | $3,005 | $71,340 | $26,610 | $44,730 |
| 2023 | $3,005 | $71,340 | $26,610 | $44,730 |
| 2022 | $3,017 | $71,340 | $26,610 | $44,730 |
| 2021 | $2,570 | $51,520 | $19,010 | $32,510 |
| 2020 | $2,573 | $51,520 | $19,010 | $32,510 |
| 2019 | $2,622 | $51,520 | $19,010 | $32,510 |
| 2018 | $2,531 | $48,070 | $19,010 | $29,060 |
| 2017 | $2,165 | $48,066 | $19,009 | $29,057 |
| 2016 | $2,150 | $48,066 | $19,009 | $29,057 |
| 2015 | $2,228 | $48,066 | $19,009 | $29,057 |
| 2014 | $2,227 | $48,066 | $19,009 | $29,057 |
| 2013 | $2,223 | $48,066 | $19,009 | $29,057 |
Source: Public Records
Map
Nearby Homes
- 3003 Vernon Asbury Rd
- 5393 Neer Rd
- 0 Mahar Rd
- 7390 Rebecca Dr
- 0 E National Rd Unit 11448359
- 0 Vernon Asbury Rd Unit 11585913
- 6421 Moorefield Rd
- 86 W Pleasant St
- 1142 Big Hill Rd
- 740 Bowman Rd
- 500 Bowman Rd
- 0 N Urbana Lisbon Rd
- 1196 George Allen Dr
- 1026 George Allen Dr
- 935 Sylvan Shores Dr
- 4831 Temple St
- 5111 Old Mechanicsburg Rd
- 3790 Vernon Asbury Rd
- 3760 Vernon Asbury Rd
- 3781 Vernon Asbury Rd
- 3763 Vernon Asbury Rd
- 3763 Vernon-Asbury Rd
- 3763 Vernon-Asbury Rd
- 3751 Vernon Asbury Rd
- 3751 Vernon-Asbury Rd
- 3737 Vernon Asbury Rd
- 3850 Vernon Asbury Rd
- 3850 Vernon-Asbury Rd
- 3723 Vernon-Asbury Rd
- 3723 Vernon Asbury Rd
- 3709 Vernon Asbury Rd
- 3890 Vernon Asbury Rd
- 3890 Vernon-Asbury Rd
- 3860 Vernon Asbury Rd
- 3860 Vernon-Asbury Rd
- 3673 Vernon Asbury Rd
- 3673 Vernon Asbury Rd