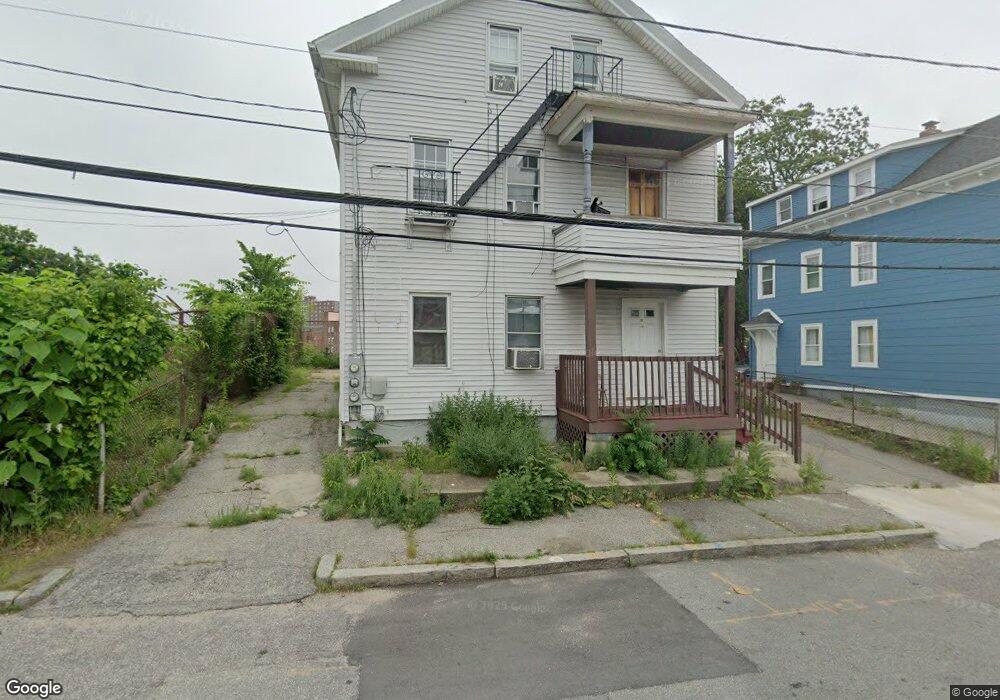
38 Atwood St Unit 40 Providence, RI 02909
Olneyville NeighborhoodEstimated Value: $346,545 - $557,000
6
Beds
3
Baths
2,700
Sq Ft
$165/Sq Ft
Est. Value
About This Home
This home is located at 38 Atwood St Unit 40, Providence, RI 02909 and is currently estimated at $445,886, approximately $165 per square foot. 38 Atwood St Unit 40 is a home located in Providence County with nearby schools including Asa Messer Elementary School, Charles N. Fortes Elementary School, and Laurel Hill Annex School.
Ownership History
Date
Name
Owned For
Owner Type
Purchase Details
Closed on
Apr 2, 2003
Sold by
Ferrer Alex
Bought by
Sereno Jose S
Current Estimated Value
Home Financials for this Owner
Home Financials are based on the most recent Mortgage that was taken out on this home.
Original Mortgage
$133,200
Interest Rate
5.88%
Mortgage Type
Purchase Money Mortgage
Purchase Details
Closed on
May 2, 2002
Sold by
Jd Investors
Bought by
Ferrer Alex
Home Financials for this Owner
Home Financials are based on the most recent Mortgage that was taken out on this home.
Original Mortgage
$99,000
Interest Rate
7.13%
Mortgage Type
Purchase Money Mortgage
Purchase Details
Closed on
Dec 29, 1995
Sold by
Dime Savings Bank Ny
Bought by
Mongelli John G
Create a Home Valuation Report for This Property
The Home Valuation Report is an in-depth analysis detailing your home's value as well as a comparison with similar homes in the area
Home Values in the Area
Average Home Value in this Area
Purchase History
| Date | Buyer | Sale Price | Title Company |
|---|---|---|---|
| Sereno Jose S | $148,000 | -- | |
| Ferrer Alex | $110,000 | -- | |
| Mongelli John G | $16,000 | -- |
Source: Public Records
Mortgage History
| Date | Status | Borrower | Loan Amount |
|---|---|---|---|
| Open | Mongelli John G | $135,000 | |
| Closed | Mongelli John G | $133,200 | |
| Previous Owner | Mongelli John G | $99,000 | |
| Previous Owner | Mongelli John G | $10,900 |
Source: Public Records
Tax History Compared to Growth
Tax History
| Year | Tax Paid | Tax Assessment Tax Assessment Total Assessment is a certain percentage of the fair market value that is determined by local assessors to be the total taxable value of land and additions on the property. | Land | Improvement |
|---|---|---|---|---|
| 2025 | $3,155 | $417,900 | $138,700 | $279,200 |
| 2024 | $5,160 | $281,200 | $91,100 | $190,100 |
| 2023 | $5,160 | $281,200 | $91,100 | $190,100 |
| 2022 | $3,546 | $281,200 | $91,100 | $190,100 |
| 2021 | $3,546 | $144,400 | $42,200 | $102,200 |
| 2020 | $2,128 | $144,400 | $42,200 | $102,200 |
| 2019 | $3,546 | $144,400 | $42,200 | $102,200 |
| 2018 | $3,250 | $101,700 | $43,900 | $57,800 |
| 2017 | $3,250 | $101,700 | $43,900 | $57,800 |
| 2016 | $3,250 | $101,700 | $43,900 | $57,800 |
| 2015 | $2,956 | $89,300 | $43,900 | $45,400 |
| 2014 | $3,014 | $89,300 | $43,900 | $45,400 |
| 2013 | $3,014 | $89,300 | $43,900 | $45,400 |
Source: Public Records
Map
Nearby Homes