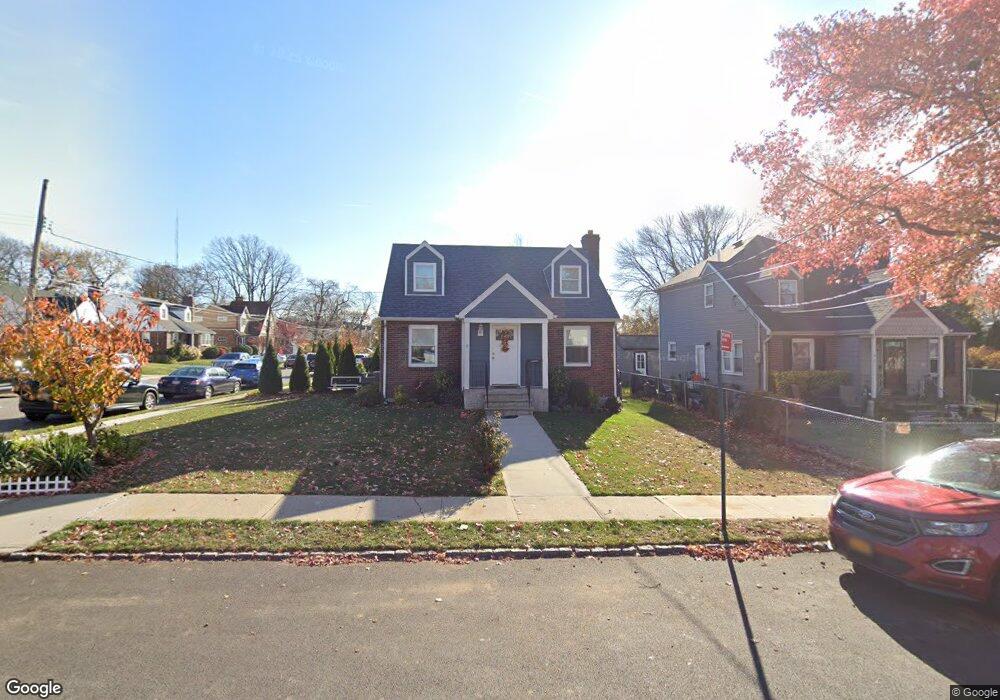
38 Crowell Ave Staten Island, NY 10314
Westerleigh NeighborhoodEstimated Value: $693,000 - $952,000
4
Beds
1
Bath
1,792
Sq Ft
$451/Sq Ft
Est. Value
About This Home
This home is located at 38 Crowell Ave, Staten Island, NY 10314 and is currently estimated at $808,425, approximately $451 per square foot. 38 Crowell Ave is a home located in Richmond County with nearby schools including P.S. 29 Bardwell, Intermediate School 27, and Susan E Wagner High School.
Ownership History
Date
Name
Owned For
Owner Type
Purchase Details
Closed on
May 5, 2022
Sold by
Agp Enterprises Inc
Bought by
Pistilli Anthony G
Current Estimated Value
Home Financials for this Owner
Home Financials are based on the most recent Mortgage that was taken out on this home.
Original Mortgage
$501,000
Outstanding Balance
$476,024
Interest Rate
5.27%
Mortgage Type
New Conventional
Estimated Equity
$332,401
Purchase Details
Closed on
Jan 17, 2020
Sold by
Bernard Joseph and Estate Of Amy Bernard
Bought by
Construct Property Solutions Llc
Purchase Details
Closed on
Jan 2, 2009
Sold by
Bernard Amy and The Rachel Siegel Family Trust
Bought by
Bernard Amy
Purchase Details
Closed on
Jan 22, 1996
Sold by
Siegel Rachel
Bought by
Siegel Rachel
Create a Home Valuation Report for This Property
The Home Valuation Report is an in-depth analysis detailing your home's value as well as a comparison with similar homes in the area
Home Values in the Area
Average Home Value in this Area
Purchase History
| Date | Buyer | Sale Price | Title Company |
|---|---|---|---|
| Pistilli Anthony G | -- | Regency Abstract | |
| Construct Property Solutions Llc | $340,000 | Boro Wide Abstract Corp | |
| Agp Enterprises Inc | $382,838 | Regency Abstract Inc | |
| Bernard Amy | -- | None Available | |
| Siegel Rachel | -- | Commonwealth Land Title Ins | |
| Siegel Rachel | -- | Commonwealth Land Title Ins |
Source: Public Records
Mortgage History
| Date | Status | Borrower | Loan Amount |
|---|---|---|---|
| Open | Pistilli Anthony G | $501,000 |
Source: Public Records
Tax History Compared to Growth
Tax History
| Year | Tax Paid | Tax Assessment Tax Assessment Total Assessment is a certain percentage of the fair market value that is determined by local assessors to be the total taxable value of land and additions on the property. | Land | Improvement |
|---|---|---|---|---|
| 2025 | $7,119 | $45,660 | $14,563 | $31,097 |
| 2024 | $7,119 | $40,920 | $15,330 | $25,590 |
| 2023 | $6,791 | $33,437 | $13,893 | $19,544 |
| 2022 | $6,347 | $37,140 | $17,700 | $19,440 |
| 2021 | $6,691 | $33,660 | $17,700 | $15,960 |
| 2020 | $6,627 | $35,400 | $17,700 | $17,700 |
| 2019 | $6,252 | $31,380 | $17,700 | $13,680 |
| 2018 | $5,680 | $27,864 | $15,930 | $11,934 |
| 2017 | $2,753 | $26,496 | $17,604 | $8,892 |
| 2016 | $5,297 | $26,496 | $16,250 | $10,246 |
| 2015 | $4,723 | $26,089 | $13,802 | $12,287 |
| 2014 | $4,723 | $24,613 | $13,545 | $11,068 |
Source: Public Records
Map
Nearby Homes
- 36 Sawyer Ave
- 80 Kemball Ave
- 125 Westcott Blvd
- 160 Westcott Blvd
- 148 Sturges St
- 136 Sturges St
- 25 Coale Ave
- 254 Rice Ave
- 328 Manor Rd
- 80 Beechwood Place
- 21 Winthrop Place
- 25 Winthrop Place
- 142 Margaretta Ct
- 17 Carolina Place
- 751 Jewett Ave Unit 17
- 751 Jewett Ave
- 33 Gower St
- 14 Leonard Ave
- 27 Sommers Ln
- 138 Kingsley Ave