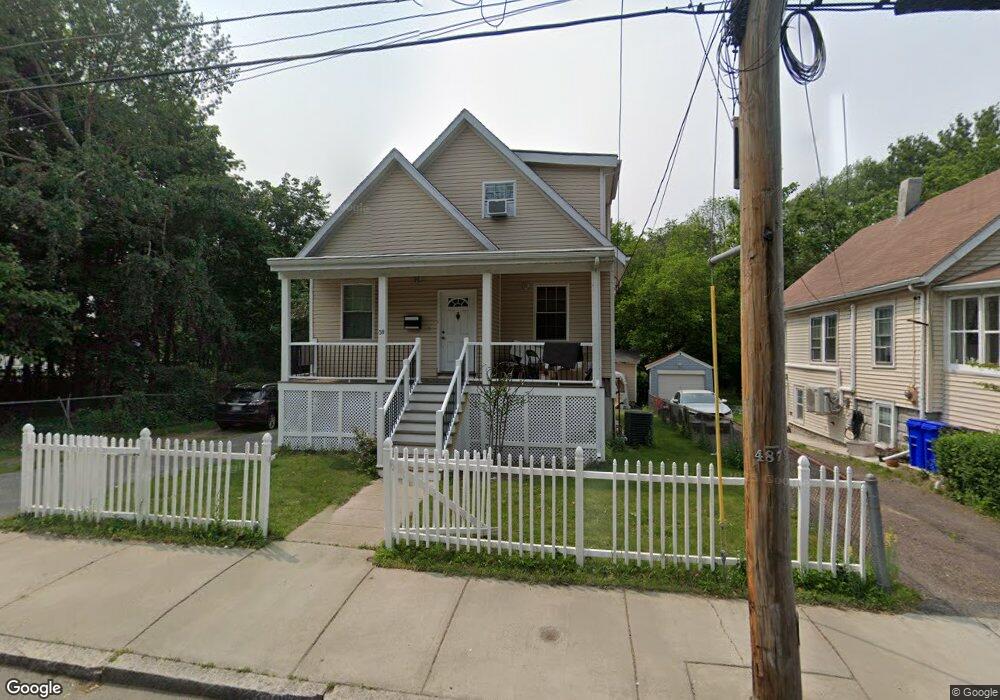
38 Lynn St Malden, MA 02148
Linden NeighborhoodEstimated Value: $723,000 - $891,000
3
Beds
3
Baths
1,778
Sq Ft
$443/Sq Ft
Est. Value
About This Home
This home is located at 38 Lynn St, Malden, MA 02148 and is currently estimated at $786,945, approximately $442 per square foot. 38 Lynn St is a home located in Middlesex County with nearby schools including Malden High School and Pioneer Charter School of Science.
Ownership History
Date
Name
Owned For
Owner Type
Purchase Details
Closed on
Jul 1, 2010
Sold by
Us Bk
Bought by
Oukani Mohamed
Current Estimated Value
Home Financials for this Owner
Home Financials are based on the most recent Mortgage that was taken out on this home.
Original Mortgage
$223,440
Interest Rate
4.88%
Mortgage Type
Purchase Money Mortgage
Purchase Details
Closed on
Jun 28, 2010
Sold by
Cardarelli Leo P
Bought by
Citimortgage Inc
Home Financials for this Owner
Home Financials are based on the most recent Mortgage that was taken out on this home.
Original Mortgage
$223,440
Interest Rate
4.88%
Mortgage Type
Purchase Money Mortgage
Purchase Details
Closed on
Nov 22, 1996
Sold by
Boudreau Joseph H and Boudreau Ethel F
Bought by
Cardarelli Leo P and Cardarelli Editha A
Create a Home Valuation Report for This Property
The Home Valuation Report is an in-depth analysis detailing your home's value as well as a comparison with similar homes in the area
Home Values in the Area
Average Home Value in this Area
Purchase History
| Date | Buyer | Sale Price | Title Company |
|---|---|---|---|
| Oukani Mohamed | $235,200 | -- | |
| Citimortgage Inc | $449,734 | -- | |
| Cardarelli Leo P | $122,500 | -- |
Source: Public Records
Mortgage History
| Date | Status | Borrower | Loan Amount |
|---|---|---|---|
| Open | Cardarelli Leo P | $221,000 | |
| Closed | Oukani Mohamed | $223,440 |
Source: Public Records
Tax History Compared to Growth
Tax History
| Year | Tax Paid | Tax Assessment Tax Assessment Total Assessment is a certain percentage of the fair market value that is determined by local assessors to be the total taxable value of land and additions on the property. | Land | Improvement |
|---|---|---|---|---|
| 2025 | $73 | $643,300 | $251,900 | $391,400 |
| 2024 | $6,966 | $595,900 | $242,900 | $353,000 |
| 2023 | $6,552 | $537,500 | $215,900 | $321,600 |
| 2022 | $6,260 | $506,900 | $193,500 | $313,400 |
| 2021 | $6,914 | $562,600 | $193,500 | $369,100 |
| 2020 | $6,865 | $542,700 | $172,300 | $370,400 |
| 2019 | $6,805 | $512,800 | $164,200 | $348,600 |
| 2018 | $7,052 | $500,500 | $164,200 | $336,300 |
| 2017 | $6,420 | $453,100 | $164,200 | $288,900 |
| 2016 | $6,293 | $415,100 | $150,800 | $264,300 |
| 2015 | $6,154 | $391,200 | $143,600 | $247,600 |
| 2014 | $5,819 | $361,400 | $130,500 | $230,900 |
Source: Public Records
Map
Nearby Homes