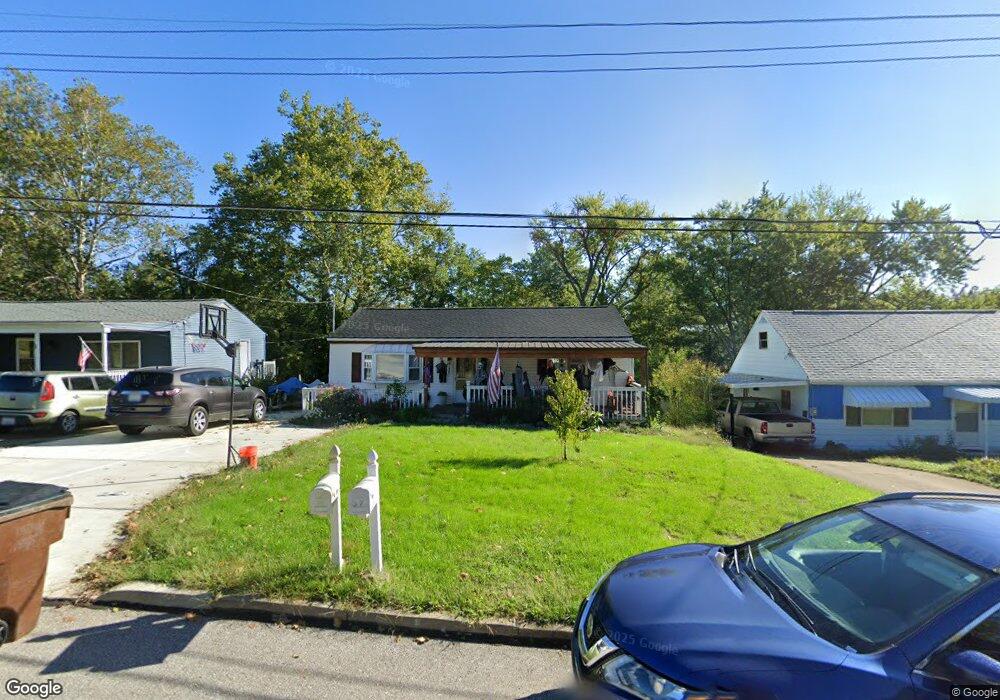
38 Vivian Dr Florence, KY 41042
Estimated Value: $134,000 - $232,000
3
Beds
2
Baths
912
Sq Ft
$218/Sq Ft
Est. Value
About This Home
This home is located at 38 Vivian Dr, Florence, KY 41042 and is currently estimated at $198,366, approximately $217 per square foot. 38 Vivian Dr is a home located in Boone County with nearby schools including A.M. Yealey Elementary School, Ockerman Middle School, and Boone County High School.
Ownership History
Date
Name
Owned For
Owner Type
Purchase Details
Closed on
Apr 24, 2009
Sold by
Jag Properties Ii Llc
Bought by
Flannery Eric L and Flannery Amber M
Current Estimated Value
Home Financials for this Owner
Home Financials are based on the most recent Mortgage that was taken out on this home.
Original Mortgage
$114,782
Outstanding Balance
$72,988
Interest Rate
5.05%
Mortgage Type
FHA
Estimated Equity
$125,378
Purchase Details
Closed on
Oct 10, 2008
Sold by
Citibank Na
Bought by
Jag Properties Llc
Purchase Details
Closed on
Mar 10, 2008
Sold by
Boeck Charles H
Bought by
Citibank Na
Purchase Details
Closed on
Jul 14, 1998
Sold by
Barker Terry B
Bought by
Boeck Charles H and Mccormack Carol A
Home Financials for this Owner
Home Financials are based on the most recent Mortgage that was taken out on this home.
Original Mortgage
$59,250
Interest Rate
7.04%
Mortgage Type
New Conventional
Create a Home Valuation Report for This Property
The Home Valuation Report is an in-depth analysis detailing your home's value as well as a comparison with similar homes in the area
Home Values in the Area
Average Home Value in this Area
Purchase History
| Date | Buyer | Sale Price | Title Company |
|---|---|---|---|
| Flannery Eric L | $116,900 | Kentucky Land Title Agency | |
| Jag Properties Llc | $63,252 | None Available | |
| Citibank Na | -- | None Available | |
| Boeck Charles H | $18,800 | -- |
Source: Public Records
Mortgage History
| Date | Status | Borrower | Loan Amount |
|---|---|---|---|
| Open | Flannery Eric L | $114,782 | |
| Previous Owner | Boeck Charles H | $59,250 |
Source: Public Records
Tax History Compared to Growth
Tax History
| Year | Tax Paid | Tax Assessment Tax Assessment Total Assessment is a certain percentage of the fair market value that is determined by local assessors to be the total taxable value of land and additions on the property. | Land | Improvement |
|---|---|---|---|---|
| 2024 | $1,196 | $124,100 | $25,000 | $99,100 |
| 2023 | $1,170 | $124,100 | $25,000 | $99,100 |
| 2022 | $924 | $97,500 | $15,000 | $82,500 |
| 2021 | $1,241 | $97,500 | $15,000 | $82,500 |
| 2020 | $946 | $97,500 | $15,000 | $82,500 |
| 2019 | $954 | $97,500 | $15,000 | $82,500 |
| 2018 | $1,012 | $97,500 | $15,000 | $82,500 |
| 2017 | $944 | $97,500 | $15,000 | $82,500 |
| 2015 | $936 | $97,500 | $15,000 | $82,500 |
| 2013 | -- | $97,500 | $15,000 | $82,500 |
Source: Public Records
Map
Nearby Homes
- 110 Hillside Dr
- 111 Buckingham Ct
- 8651 Valley Circle Dr
- 139 Yealey Dr
- 0 Hopeful Church Rd Unit 612065
- 8870 Valley Circle Dr
- 170 Burgess Ln
- 8856 Boone Valley Dr
- 73 W Cobblestone Ct
- 8375 Cypress Ln
- 9 Creekside Dr
- 8104 Harms Hill Dr
- 1278 Cayton Rd
- 39 Rio Grande Cir Unit 5
- 858 Ridgeview Dr
- 865 Ridgeview Dr
- 65 Miriam Dr
- 1316 Ashford Dr
- 0 Gunpowder Rd
- 6469 Deermeade Dr