Estimated Value: $222,341 - $337,000
3
Beds
2
Baths
920
Sq Ft
$313/Sq Ft
Est. Value
About This Home
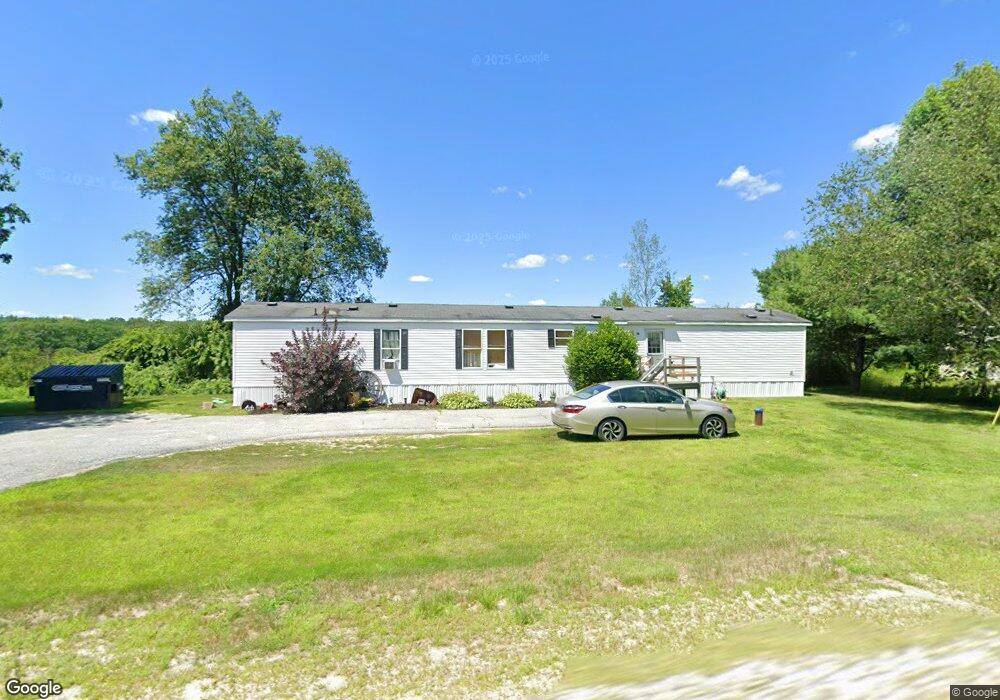
This home is located at 38 W Minot Rd, Minot, ME 04258 and is currently estimated at $287,835, approximately $312 per square foot. 38 W Minot Rd is a home located in Androscoggin County with nearby schools including Minot Consolidated School.
Ownership History
Date
Name
Owned For
Owner Type
Purchase Details
Closed on
Aug 29, 2018
Sold by
Hammond Jaime L
Bought by
Hammond Jaime L and Tipton Chad M
Current Estimated Value
Purchase Details
Closed on
Aug 28, 2018
Sold by
Hammond Jamie L
Bought by
Hammond Jamie L and Tipton Chad M
Purchase Details
Closed on
Jan 25, 2008
Sold by
Hammond Corey J and Hammond Christy N
Bought by
Coulter Kevin and Beardsley Janet
Home Financials for this Owner
Home Financials are based on the most recent Mortgage that was taken out on this home.
Original Mortgage
$60,000
Outstanding Balance
$38,064
Interest Rate
6.17%
Mortgage Type
Purchase Money Mortgage
Estimated Equity
$249,771
Purchase Details
Closed on
Sep 11, 2007
Sold by
Piper Donald G
Bought by
Hammond Jaime L
Home Financials for this Owner
Home Financials are based on the most recent Mortgage that was taken out on this home.
Original Mortgage
$86,712
Interest Rate
6.74%
Mortgage Type
FHA
Create a Home Valuation Report for This Property
The Home Valuation Report is an in-depth analysis detailing your home's value as well as a comparison with similar homes in the area
Home Values in the Area
Average Home Value in this Area
Purchase History
| Date | Buyer | Sale Price | Title Company |
|---|---|---|---|
| Hammond Jaime L | -- | -- | |
| Hammond Jamie L | -- | -- | |
| Coulter Kevin | -- | -- | |
| Hammond Jaime L | -- | -- |
Source: Public Records
Mortgage History
| Date | Status | Borrower | Loan Amount |
|---|---|---|---|
| Open | Hammond Jaime L | $60,000 | |
| Previous Owner | Hammond Jaime L | $86,712 | |
| Previous Owner | Hammond Jaime L | $86,712 |
Source: Public Records
Tax History Compared to Growth
Tax History
| Year | Tax Paid | Tax Assessment Tax Assessment Total Assessment is a certain percentage of the fair market value that is determined by local assessors to be the total taxable value of land and additions on the property. | Land | Improvement |
|---|---|---|---|---|
| 2024 | $1,498 | $134,389 | $55,610 | $78,779 |
| 2023 | $1,344 | $134,389 | $55,610 | $78,779 |
| 2022 | $1,324 | $134,389 | $55,610 | $78,779 |
| 2021 | $1,065 | $64,352 | $29,927 | $34,425 |
| 2020 | $854 | $51,624 | $29,927 | $21,697 |
| 2019 | $818 | $51,624 | $29,927 | $21,697 |
| 2018 | $0 | $51,624 | $29,927 | $21,697 |
| 2017 | $810 | $51,624 | $29,927 | $21,697 |
| 2016 | $795 | $51,624 | $29,927 | $21,697 |
| 2015 | $805 | $51,624 | $29,927 | $21,697 |
| 2014 | $774 | $51,624 | $29,927 | $21,697 |
Source: Public Records
Map
Nearby Homes
- 78 Star Dr
- 24 Clifford St
- 450 Millett Rd
- 62 North St
- 30 North St
- 63 Elm St
- 91 Lewiston St
- 90 Elm St
- 91 Elm St
- R03-007-A Pottle Hill Rd
- 30 Highland Ave
- 107 Riverside Dr
- 125 S Main St
- 71 Jordan Rd
- 389 Pleasant St
- 33 Dunlop Ave
- 19 Tirrell Ave
- 11 Scenic Heights Dr
- 12 Scenic Heights Dr
- 10 Scenic Heights Dr
- 0 Grange Road Lot #3
- 0 Grange Road Lot #1
- 00 Grange
- 0 Grange Ave Lot #2
- 0 Grange Ave Lot #3
- 0 Grange Ave Lot #4
- 0 Grange Road Lot #2
- 40 W Minot Rd
- 18 W Minot Rd
- 100 W Minot Rd
- 23 W Minot Rd
- 1 Grange Ave
- 6 W Minot Rd
- 95 W Minot Rd
- 28 Grange Ave
- 42 Grange Ave
- R3 LOT 37 Grange Ave
- 0 W Minot Rd
- 1 W Minot Road (Rt 124)
- 5 W Minot Rd