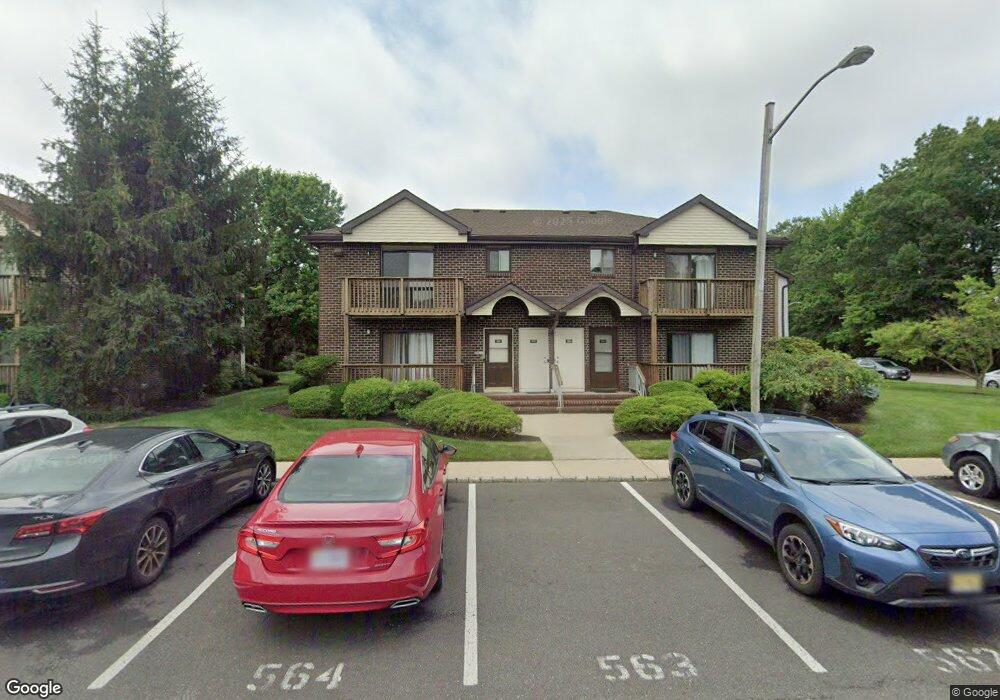
3803 Birchwood Ct North Brunswick, NJ 08902
Estimated Value: $279,000 - $364,000
1
Bed
1
Bath
918
Sq Ft
$340/Sq Ft
Est. Value
About This Home
This home is located at 3803 Birchwood Ct, North Brunswick, NJ 08902 and is currently estimated at $312,226, approximately $340 per square foot. 3803 Birchwood Ct is a home located in Middlesex County with nearby schools including Arthur M. Judd Elementary School, Linwood Middle School, and North Brunswick Twp High School.
Ownership History
Date
Name
Owned For
Owner Type
Purchase Details
Closed on
Sep 19, 2003
Sold by
Oppenheimer Aimee
Bought by
Kearse Eric
Current Estimated Value
Home Financials for this Owner
Home Financials are based on the most recent Mortgage that was taken out on this home.
Original Mortgage
$128,000
Interest Rate
6.09%
Purchase Details
Closed on
Mar 18, 2002
Sold by
Staten Tamara
Bought by
Oppeheimer Aimee
Home Financials for this Owner
Home Financials are based on the most recent Mortgage that was taken out on this home.
Original Mortgage
$86,975
Interest Rate
7.18%
Purchase Details
Closed on
Jul 28, 2000
Sold by
Mihalko John
Bought by
Staten Tamara
Home Financials for this Owner
Home Financials are based on the most recent Mortgage that was taken out on this home.
Original Mortgage
$70,000
Interest Rate
8.21%
Mortgage Type
FHA
Create a Home Valuation Report for This Property
The Home Valuation Report is an in-depth analysis detailing your home's value as well as a comparison with similar homes in the area
Home Values in the Area
Average Home Value in this Area
Purchase History
| Date | Buyer | Sale Price | Title Company |
|---|---|---|---|
| Kearse Eric | $132,000 | -- | |
| Oppeheimer Aimee | $90,500 | -- | |
| Staten Tamara | $72,165 | -- |
Source: Public Records
Mortgage History
| Date | Status | Borrower | Loan Amount |
|---|---|---|---|
| Previous Owner | Kearse Eric | $128,000 | |
| Previous Owner | Oppeheimer Aimee | $86,975 | |
| Previous Owner | Staten Tamara | $70,000 |
Source: Public Records
Tax History Compared to Growth
Tax History
| Year | Tax Paid | Tax Assessment Tax Assessment Total Assessment is a certain percentage of the fair market value that is determined by local assessors to be the total taxable value of land and additions on the property. | Land | Improvement |
|---|---|---|---|---|
| 2025 | $3,909 | $61,700 | $20,000 | $41,700 |
| 2024 | $3,839 | $61,700 | $20,000 | $41,700 |
| 2023 | $3,839 | $61,700 | $20,000 | $41,700 |
| 2022 | $3,708 | $61,700 | $20,000 | $41,700 |
| 2021 | $2,702 | $61,700 | $20,000 | $41,700 |
| 2020 | $3,570 | $61,700 | $20,000 | $41,700 |
| 2019 | $3,497 | $61,700 | $20,000 | $41,700 |
| 2018 | $3,426 | $61,700 | $20,000 | $41,700 |
| 2017 | $3,365 | $61,700 | $20,000 | $41,700 |
| 2016 | $3,295 | $61,700 | $20,000 | $41,700 |
| 2015 | $3,239 | $61,700 | $20,000 | $41,700 |
| 2014 | $3,202 | $61,700 | $20,000 | $41,700 |
Source: Public Records
Map
Nearby Homes
- 3807 Birchwood Ct
- 3910 Birchwood Ct
- 4417 Birchwood Ct
- 17 David Dr
- 1584 Holly Rd
- 89 Pennsylvania Way
- 1827 Oak Rd
- 149 Pennsylvania Way
- 224 Pennsylvania Way
- 1314 N Oaks Blvd
- 1010 N Oaks Blvd
- 910 N Oaks Blvd
- 32 Lafayette Ct
- 457 Barrymore Place
- 210 N Oaks Blvd Unit 210
- 5208 N Oaks Blvd
- 430 Wood Ave
- 34 Princess Dr
- 276 Constitution Cir
- 41 Lynn Ct
- 3802 Birchwood Ct
- 3804 Birchwood Ct
- 3801 Birchwood Ct
- 3801 Birchwood Ct Unit 1
- 3806 Birchwood Ct
- 3805 Birchwood Ct
- 3807 Birchwood Ct Unit 7
- 3808 Birchwood Ct
- 3720 Birchwood Ct
- 3719 Birchwood Ct
- 3809 Birchwood Ct
- 3810 Birchwood Ct
- 3718 Birchwood Ct
- 3718 Birchwood Ct Unit 3718
- 3718 Birchwood Ct Unit 18
- 3717 Birchwood Ct
- 3811 Birchwood Ct Unit 3811
- 3716 Birchwood Ct
- 3812 Birchwood Ct Unit 3812
- 3714 Birchwood Ct