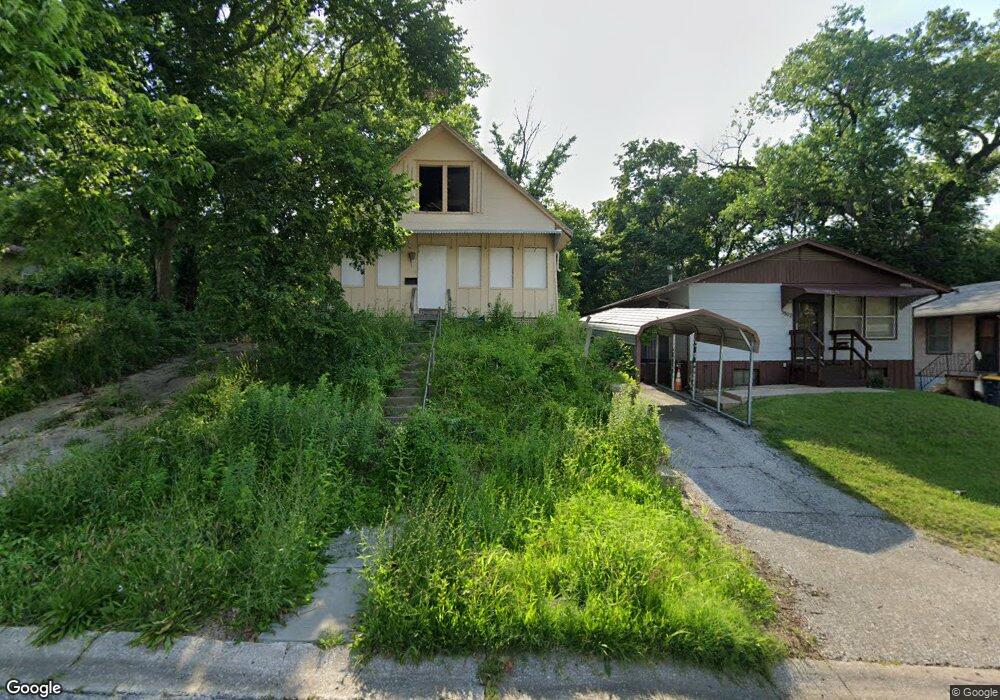
3806 Myrtle Ave Kansas City, MO 64128
Palestine East NeighborhoodEstimated Value: $80,000 - $143,000
4
Beds
2
Baths
1,459
Sq Ft
$71/Sq Ft
Est. Value
About This Home
This home is located at 3806 Myrtle Ave, Kansas City, MO 64128 and is currently estimated at $103,638, approximately $71 per square foot. 3806 Myrtle Ave is a home located in Jackson County with nearby schools including George Melcher Elementary School, Central Middle School, and Central High School.
Ownership History
Date
Name
Owned For
Owner Type
Purchase Details
Closed on
Dec 21, 2004
Sold by
Carter Lamon and Dellutri Carter Laura J
Bought by
Acc Management Group Inc
Current Estimated Value
Purchase Details
Closed on
Aug 10, 2004
Sold by
Ward Carlos and Ward Anne Lou
Bought by
Acc Management Group Inc
Home Financials for this Owner
Home Financials are based on the most recent Mortgage that was taken out on this home.
Original Mortgage
$42,000
Interest Rate
6.18%
Mortgage Type
Purchase Money Mortgage
Purchase Details
Closed on
Jul 18, 2000
Sold by
Centex Home Equity Corp
Bought by
Ward Carlos
Purchase Details
Closed on
Aug 13, 1998
Sold by
Bennett and Edna
Bought by
Hayden Jacqueline
Home Financials for this Owner
Home Financials are based on the most recent Mortgage that was taken out on this home.
Original Mortgage
$24,750
Interest Rate
6.95%
Mortgage Type
Purchase Money Mortgage
Purchase Details
Closed on
Sep 15, 1995
Sold by
Baldwin Patty
Bought by
Bennett John and Bennett Edna
Create a Home Valuation Report for This Property
The Home Valuation Report is an in-depth analysis detailing your home's value as well as a comparison with similar homes in the area
Home Values in the Area
Average Home Value in this Area
Purchase History
| Date | Buyer | Sale Price | Title Company |
|---|---|---|---|
| Acc Management Group Inc | -- | Kansas City Title | |
| Carter Lamon | -- | Kansas City Title | |
| Acc Management Group Inc | -- | Old Republic Title | |
| Ward Carlos | -- | First American Title Ins | |
| Hayden Jacqueline | -- | -- | |
| Bennett John | -- | -- |
Source: Public Records
Mortgage History
| Date | Status | Borrower | Loan Amount |
|---|---|---|---|
| Previous Owner | Acc Management Group Inc | $42,000 | |
| Previous Owner | Hayden Jacqueline | $24,750 |
Source: Public Records
Tax History Compared to Growth
Tax History
| Year | Tax Paid | Tax Assessment Tax Assessment Total Assessment is a certain percentage of the fair market value that is determined by local assessors to be the total taxable value of land and additions on the property. | Land | Improvement |
|---|---|---|---|---|
| 2025 | $520 | $7,257 | $521 | $6,736 |
| 2024 | $515 | $6,584 | $844 | $5,740 |
| 2023 | $515 | $6,583 | $201 | $6,382 |
| 2022 | $516 | $6,270 | $589 | $5,681 |
| 2021 | $514 | $6,270 | $589 | $5,681 |
| 2020 | $499 | $6,007 | $589 | $5,418 |
| 2019 | $488 | $6,007 | $589 | $5,418 |
| 2018 | $0 | $5,172 | $656 | $4,516 |
| 2017 | $0 | $5,172 | $656 | $4,516 |
| 2016 | $0 | $5,042 | $323 | $4,719 |
| 2014 | $405 | $5,042 | $323 | $4,719 |
Source: Public Records
Map
Nearby Homes
- 3801 Mersington Ave
- 3920 Spruce Ave
- 4015 Myrtle Ave
- 3640 Cleveland Ave
- 4016 Askew Ave
- 3831 Indiana Ave
- 4032 Kensington Ave
- 3818 Indiana Ave
- 3816 Indiana Ave
- 4135 Jackson Ave
- 3721 Elmwood Ave
- 4132 Spruce Ave
- 3715 College Ave
- 3411 E 36th St
- 4200 Monroe Ave
- 3919 Benton Blvd
- 4210 Monroe Ave
- 3622 College Ave
- 4214 Monroe Ave
- 3431 Monroe Ave
- 3802 Myrtle Ave
- 3812 Myrtle Ave
- 3800 Myrtle Ave
- 3816 Myrtle Ave
- 3807 Mersington Ave
- 3803 Mersington Ave
- 3811 Mersington Ave
- 3815 Mersington Ave
- 3811 Myrtle Ave
- 3817 Mersington Ave
- 3746 Myrtle Ave
- 3805 Myrtle Ave
- 3801 Myrtle Ave
- 3745 Myrtle Ave
- 3815 Myrtle Ave
- 3742 Myrtle Ave
- 3819 Myrtle Ave
- 3825 Mersington Ave
- 3832 Myrtle Ave
- 3741 Myrtle Ave