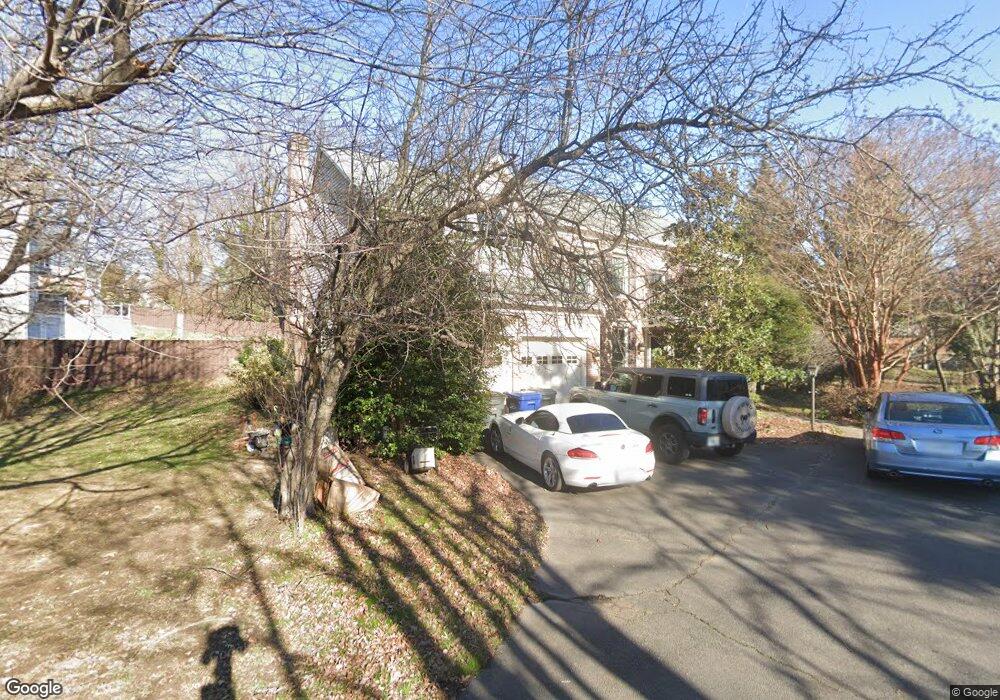
3813 Munson Rd Falls Church, VA 22041
Estimated Value: $1,161,162 - $1,248,000
4
Beds
4
Baths
3,062
Sq Ft
$390/Sq Ft
Est. Value
About This Home
This home is located at 3813 Munson Rd, Falls Church, VA 22041 and is currently estimated at $1,195,291, approximately $390 per square foot. 3813 Munson Rd is a home located in Fairfax County with nearby schools including Glasgow Middle School, Justice High School, and Full Circle Montessori School.
Ownership History
Date
Name
Owned For
Owner Type
Purchase Details
Closed on
Nov 1, 2019
Sold by
Gorski Corinne R
Bought by
Gorski Corinne R and The Corinne R Gorski Trust
Current Estimated Value
Purchase Details
Closed on
Aug 31, 1993
Bought by
Gorski Joseph M and Gorski Corinne R
Create a Home Valuation Report for This Property
The Home Valuation Report is an in-depth analysis detailing your home's value as well as a comparison with similar homes in the area
Home Values in the Area
Average Home Value in this Area
Purchase History
| Date | Buyer | Sale Price | Title Company |
|---|---|---|---|
| Gorski Corinne R | -- | None Available | |
| Gorski Corinne R | -- | None Available | |
| Gorski Joseph M | $320,300 | -- |
Source: Public Records
Tax History Compared to Growth
Tax History
| Year | Tax Paid | Tax Assessment Tax Assessment Total Assessment is a certain percentage of the fair market value that is determined by local assessors to be the total taxable value of land and additions on the property. | Land | Improvement |
|---|---|---|---|---|
| 2025 | $12,370 | $1,074,100 | $375,000 | $699,100 |
| 2024 | $12,370 | $1,003,360 | $350,000 | $653,360 |
| 2023 | $11,476 | $963,230 | $335,000 | $628,230 |
| 2022 | $10,252 | $846,150 | $285,000 | $561,150 |
| 2021 | $9,372 | $756,810 | $250,000 | $506,810 |
| 2020 | $8,890 | $712,680 | $230,000 | $482,680 |
| 2019 | $8,845 | $707,680 | $225,000 | $482,680 |
| 2018 | $8,233 | $715,890 | $225,000 | $490,890 |
| 2017 | $8,750 | $715,890 | $225,000 | $490,890 |
| 2016 | $8,746 | $715,890 | $225,000 | $490,890 |
| 2015 | $8,178 | $692,590 | $216,000 | $476,590 |
| 2014 | $7,886 | $668,260 | $210,000 | $458,260 |
Source: Public Records
Map
Nearby Homes
- 5904 Carver Place
- 5715 Magnolia Ln
- 3721 Munson Rd
- 5817 Dawes Ave
- 5527 Bouffant Blvd
- 5505 Seminary Rd Unit 905N
- 5505 Seminary Rd Unit 2205N
- 5505 Seminary Rd Unit 2405N
- 5501 Seminary Rd Unit 801S
- 5501 Seminary Rd Unit 913S
- 5501 Seminary Rd Unit 114S
- 5575 Seminary Rd Unit 312
- 3800 Powell Ln Unit 1121
- 3800 Powell Ln Unit 1207
- 3800 Powell Ln Unit 519
- 2699 Centennial Ct
- 3444 Washington Dr
- 5116 Woodmire Ln
- 3713 S George Mason Dr Unit 1102
- 3713 S George Mason Dr Unit 1115 W
- 3815 Munson Rd
- 3811 Munson Rd
- 3809 Munson Rd
- 3817 Munson Rd
- 3808 Lacy Blvd
- 3810 Lacy Blvd
- 3807 Munson Rd
- 3804 Lacy Blvd
- 5806 Magnolia Ln
- 5804 Magnolia Ln
- 5802 Magnolia Ln
- 3819 Munson Rd
- 3814 Lacy Blvd
- 3814 Munson Rd
- 3816 Munson Rd
- 3805 Munson Rd
- 3816 Lacy Blvd
- 5800 Magnolia Ln
- 3726 Lacy Blvd
- 5816 Magnolia Ln