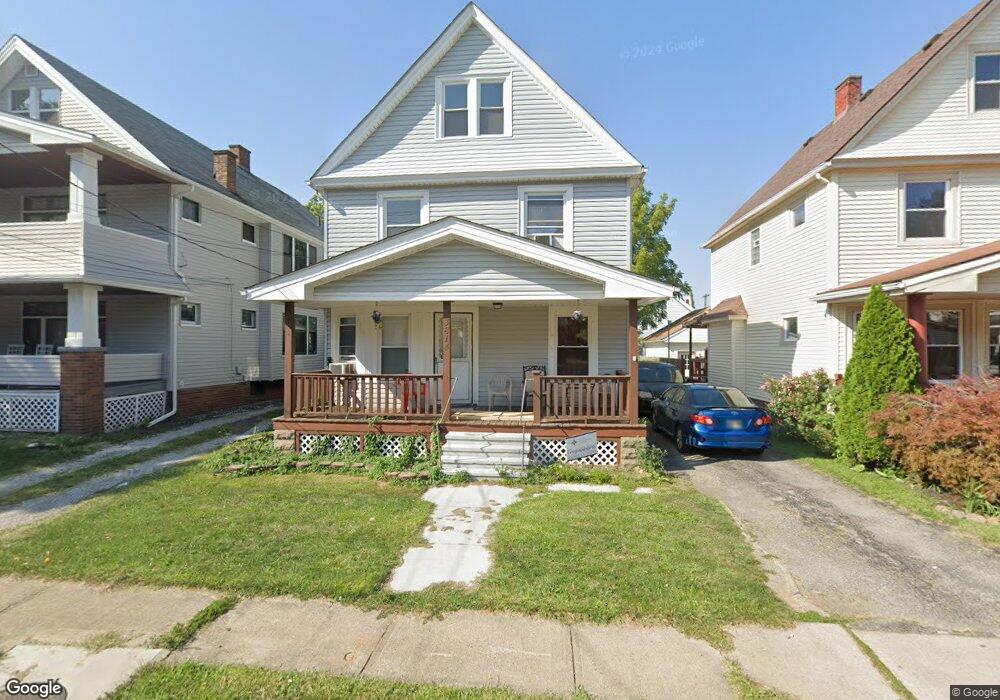
3814 Cecilia Ave Cleveland, OH 44109
Old Brooklyn NeighborhoodEstimated Value: $132,000 - $147,000
4
Beds
1
Bath
1,374
Sq Ft
$101/Sq Ft
Est. Value
About This Home
This home is located at 3814 Cecilia Ave, Cleveland, OH 44109 and is currently estimated at $139,221, approximately $101 per square foot. 3814 Cecilia Ave is a home located in Cuyahoga County with nearby schools including Benjamin Franklin, Almira Academy, and Artemus Ward School.
Ownership History
Date
Name
Owned For
Owner Type
Purchase Details
Closed on
Jun 9, 2021
Sold by
Buttazzoni Lino B and Buttazzoni Rosanna
Bought by
Torres Donna J
Current Estimated Value
Home Financials for this Owner
Home Financials are based on the most recent Mortgage that was taken out on this home.
Original Mortgage
$98,188
Interest Rate
2.9%
Mortgage Type
New Conventional
Purchase Details
Closed on
May 28, 1999
Sold by
Buttazzoni Lino B
Bought by
Buttazzoni Lino B and Buttazzoni Rosanna
Purchase Details
Closed on
May 2, 1988
Sold by
Childress Joe P
Bought by
Buttazzoni Lino B
Purchase Details
Closed on
Jan 6, 1986
Sold by
Childress Mary Ann
Bought by
Childress Joe P
Purchase Details
Closed on
Oct 10, 1985
Sold by
Childress Joe P and Childress Wilma F
Bought by
Childress Mary Ann
Purchase Details
Closed on
Jan 1, 1975
Bought by
Childress Joe P and Childress Wilma F
Create a Home Valuation Report for This Property
The Home Valuation Report is an in-depth analysis detailing your home's value as well as a comparison with similar homes in the area
Home Values in the Area
Average Home Value in this Area
Purchase History
| Date | Buyer | Sale Price | Title Company |
|---|---|---|---|
| Torres Donna J | $100,000 | City Title Company | |
| Buttazzoni Lino B | -- | -- | |
| Buttazzoni Lino B | $30,700 | -- | |
| Childress Joe P | -- | -- | |
| Childress Mary Ann | -- | -- | |
| Childress Joe P | -- | -- |
Source: Public Records
Mortgage History
| Date | Status | Borrower | Loan Amount |
|---|---|---|---|
| Previous Owner | Torres Donna J | $98,188 |
Source: Public Records
Tax History Compared to Growth
Tax History
| Year | Tax Paid | Tax Assessment Tax Assessment Total Assessment is a certain percentage of the fair market value that is determined by local assessors to be the total taxable value of land and additions on the property. | Land | Improvement |
|---|---|---|---|---|
| 2024 | $2,511 | $38,290 | $8,015 | $30,275 |
| 2023 | $2,284 | $30,100 | $5,495 | $24,605 |
| 2022 | $2,271 | $30,100 | $5,500 | $24,610 |
| 2021 | $2,299 | $30,100 | $5,500 | $24,610 |
| 2020 | $2,063 | $23,350 | $4,270 | $19,080 |
| 2019 | $1,910 | $66,700 | $12,200 | $54,500 |
| 2018 | $1,892 | $23,350 | $4,270 | $19,080 |
| 2017 | $1,895 | $22,410 | $3,330 | $19,080 |
| 2016 | $1,880 | $22,410 | $3,330 | $19,080 |
| 2015 | $2,096 | $22,410 | $3,330 | $19,080 |
| 2014 | $2,096 | $24,890 | $3,710 | $21,180 |
Source: Public Records
Map
Nearby Homes
- 3908 Behrwald Ave
- 3909 Behrwald Ave
- 3704 Dawning Ave
- 3616 Cecilia Ave
- 3513 Dawning Ave
- 4002 Ardmore Ave
- 3514 Leopold Ave
- 3404 Cypress Ave
- 3816 Bucyrus Ave
- 4581 Pearl Rd
- 3911 Biddulph Ave
- 3301 Hillcrest Ave
- 4611 W 41st St
- 4329 Ardmore Ave
- 4520 Wichita Ave
- 3821 Spokane Ave
- 4315 Stickney Ave
- 4491 W 30th St
- 2810 Natchez Ave
- 4615 Ardmore Ave
- 3810 Cecilia Ave
- 3818 Cecilia Ave
- 3806 Cecilia Ave
- 3822 Cecilia Ave
- 3823 Dawning Ave
- 3900 Cecilia Ave
- 3825 Dawning Ave
- 3821 Dawning Ave
- 3829 Dawning Ave
- 3780 Cecilia Ave
- 3817 Dawning Ave
- 3815 Cecilia Ave
- 3833 Dawning Ave
- 3811 Cecilia Ave
- 3821 Cecilia Ave
- 3904 Cecilia Ave
- 3722 Cecilia Ave
- 3807 Cecilia Ave
- 3823 Cecilia Ave
- 3809 Dawning Ave