Estimated Value: $381,925 - $552,000
--
Bed
5
Baths
2,705
Sq Ft
$162/Sq Ft
Est. Value
About This Home
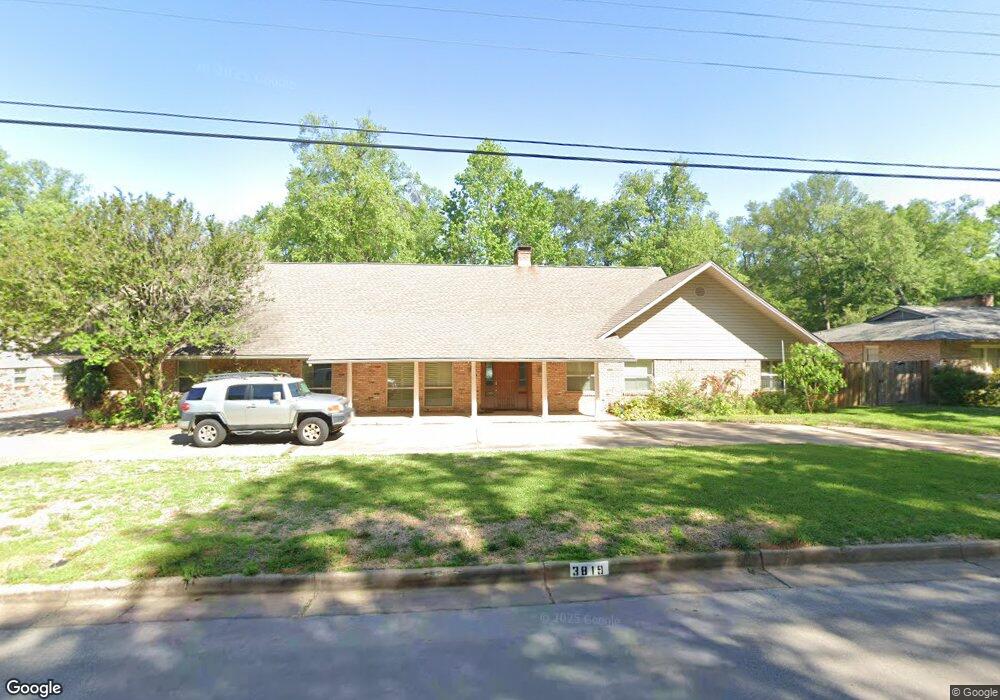
This home is located at 3819 Fry Ave, Tyler, TX 75701 and is currently estimated at $437,481, approximately $161 per square foot. 3819 Fry Ave is a home located in Smith County with nearby schools including Woods Elementary School, Hubbard Middle School, and Tyler Legacy High School.
Ownership History
Date
Name
Owned For
Owner Type
Purchase Details
Closed on
Jan 31, 2022
Sold by
Bain Denise and Graber Denise Bain
Bought by
Mason Steven M and Mason Margaret R
Current Estimated Value
Home Financials for this Owner
Home Financials are based on the most recent Mortgage that was taken out on this home.
Original Mortgage
$348,300
Outstanding Balance
$320,814
Interest Rate
3.22%
Mortgage Type
New Conventional
Estimated Equity
$116,667
Create a Home Valuation Report for This Property
The Home Valuation Report is an in-depth analysis detailing your home's value as well as a comparison with similar homes in the area
Home Values in the Area
Average Home Value in this Area
Purchase History
| Date | Buyer | Sale Price | Title Company |
|---|---|---|---|
| Mason Steven M | -- | None Listed On Document |
Source: Public Records
Mortgage History
| Date | Status | Borrower | Loan Amount |
|---|---|---|---|
| Open | Mason Steven M | $348,300 |
Source: Public Records
Tax History Compared to Growth
Tax History
| Year | Tax Paid | Tax Assessment Tax Assessment Total Assessment is a certain percentage of the fair market value that is determined by local assessors to be the total taxable value of land and additions on the property. | Land | Improvement |
|---|---|---|---|---|
| 2025 | $6,557 | $361,237 | $54,411 | $306,826 |
| 2024 | $6,557 | $385,424 | $43,190 | $342,234 |
| 2023 | $6,754 | $387,481 | $43,190 | $344,291 |
| 2022 | $5,877 | $315,797 | $37,020 | $278,777 |
| 2021 | $5,721 | $272,684 | $37,020 | $235,664 |
| 2020 | $5,673 | $269,218 | $37,020 | $232,198 |
| 2019 | $9,420 | $240,997 | $24,680 | $216,317 |
| 2018 | $4,902 | $225,385 | $24,680 | $200,705 |
| 2017 | $4,986 | $233,524 | $24,680 | $208,844 |
| 2016 | $4,828 | $226,131 | $24,680 | $201,451 |
| 2015 | $3,179 | $214,084 | $24,680 | $189,404 |
| 2014 | $3,179 | $208,446 | $24,680 | $183,766 |
Source: Public Records
Map
Nearby Homes
- 3710 Bain Place
- 4021 New Copeland Rd
- 3712 Colony Park Dr
- 3511 S Keaton Ave
- 1107 Pinedale Place
- 3523 S Cameron Ave
- 1113 E Amherst Dr
- 1408 Westfield St
- 1505 Glenrose St
- 4601 Cambridge Dr
- 3210 S Donnybrook Ave
- 1018 Pollard Dr
- 4211 Birdwell Dr
- 3202 S Donnybrook Ave
- 1608 Yosemite Dr
- 3400 Birdwell Dr
- 3235 Curtis Dr
- 817 Woodhall Ct
- 3215 Curtis Dr
- 1101 Clyde Dr
- 3819 3819 Fry Ave
- 3827 Fry Ave
- 3809 Fry Ave
- 3721 Bain Place
- 3826 Fry Ave
- 3802 Wynnwood Dr
- 3818 Fry Ave
- 3801 3801 Fry Ave
- 3801 Fry Ave
- 3835 Fry Ave
- 3832 3832 Ferry
- 3832 Fry Ave
- 3802 3802 Wynnwood
- 3710 3710 Bain
- 3710 Wynnwood Dr
- 3711 Bain Place
- 3710 3710 Wynnwood
- 3838 Fry Ave
- 3903 Pinedale Place
- 3727 Fry Ave