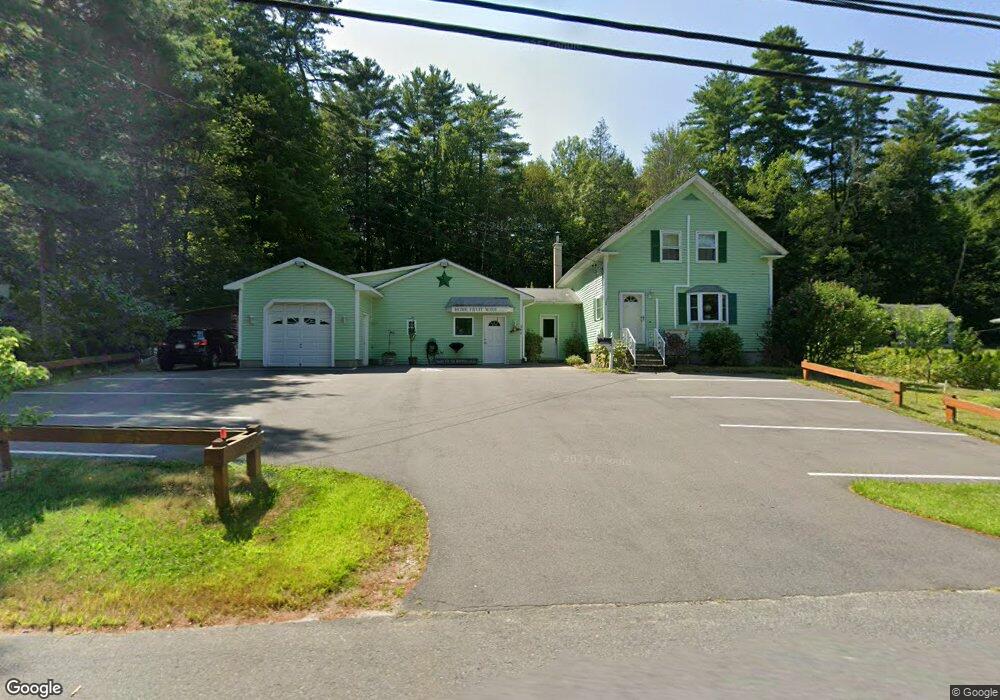
382 S Main St Orange, MA 01364
Estimated Value: $409,333
2
Beds
2
Baths
1,200
Sq Ft
$341/Sq Ft
Est. Value
About This Home
This home is located at 382 S Main St, Orange, MA 01364 and is currently estimated at $409,333, approximately $341 per square foot. 382 S Main St is a home located in Franklin County with nearby schools including Fisher Hill and Ralph C Mahar Regional School.
Ownership History
Date
Name
Owned For
Owner Type
Purchase Details
Closed on
Sep 2, 1988
Sold by
Jawma Corp
Bought by
Leclaire David R
Current Estimated Value
Home Financials for this Owner
Home Financials are based on the most recent Mortgage that was taken out on this home.
Original Mortgage
$91,000
Interest Rate
10.38%
Mortgage Type
Commercial
Purchase Details
Closed on
Feb 4, 1988
Sold by
Jaworski Walter C
Bought by
Jawma Corp
Purchase Details
Closed on
Mar 2, 1987
Sold by
Lehoux James M
Bought by
Lovewell Carolanne
Home Financials for this Owner
Home Financials are based on the most recent Mortgage that was taken out on this home.
Original Mortgage
$60,000
Interest Rate
9.19%
Mortgage Type
Commercial
Create a Home Valuation Report for This Property
The Home Valuation Report is an in-depth analysis detailing your home's value as well as a comparison with similar homes in the area
Home Values in the Area
Average Home Value in this Area
Purchase History
| Date | Buyer | Sale Price | Title Company |
|---|---|---|---|
| Leclaire David R | $91,000 | -- | |
| Jawma Corp | $6,000 | -- | |
| Lovewell Carolanne | $6,000 | -- |
Source: Public Records
Mortgage History
| Date | Status | Borrower | Loan Amount |
|---|---|---|---|
| Closed | Lovewell Carolanne | $91,000 | |
| Previous Owner | Lovewell Carolanne | $60,000 |
Source: Public Records
Tax History Compared to Growth
Tax History
| Year | Tax Paid | Tax Assessment Tax Assessment Total Assessment is a certain percentage of the fair market value that is determined by local assessors to be the total taxable value of land and additions on the property. | Land | Improvement |
|---|---|---|---|---|
| 2025 | $57 | $346,700 | $29,600 | $317,100 |
| 2024 | $5,150 | $295,300 | $29,600 | $265,700 |
| 2023 | $4,587 | $255,400 | $26,600 | $228,800 |
| 2022 | $3,140 | $164,200 | $26,600 | $137,600 |
| 2021 | $3,318 | $165,500 | $45,200 | $120,300 |
| 2020 | $3,171 | $156,000 | $41,200 | $114,800 |
| 2019 | $3,144 | $139,600 | $35,700 | $103,900 |
| 2018 | $2,683 | $122,300 | $33,300 | $89,000 |
| 2017 | $2,596 | $122,300 | $33,300 | $89,000 |
| 2016 | $2,411 | $111,100 | $29,700 | $81,400 |
| 2015 | $2,239 | $107,800 | $31,700 | $76,100 |
| 2014 | $2,280 | $115,500 | $31,700 | $83,800 |
Source: Public Records
Map
Nearby Homes