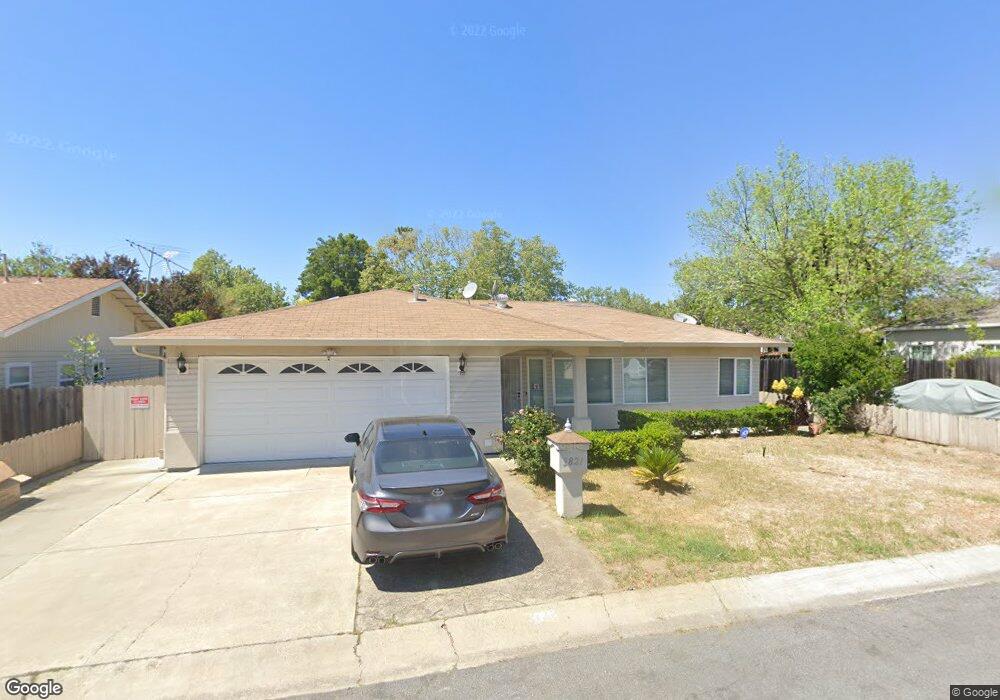
3821 Clough Ave Fremont, CA 94538
Irvington NeighborhoodEstimated Value: $1,242,000 - $1,461,000
4
Beds
2
Baths
1,385
Sq Ft
$981/Sq Ft
Est. Value
About This Home
This home is located at 3821 Clough Ave, Fremont, CA 94538 and is currently estimated at $1,358,833, approximately $981 per square foot. 3821 Clough Ave is a home located in Alameda County with nearby schools including J. Haley Durham Elementary School, G.M. Walters Middle School, and John F. Kennedy High School.
Ownership History
Date
Name
Owned For
Owner Type
Purchase Details
Closed on
Jan 3, 2023
Sold by
Naraharisetty Ravi Teja and Padmanjana Sow
Bought by
Ravi Teja And Padmanjana Revocable Trust
Current Estimated Value
Purchase Details
Closed on
Jan 27, 2017
Sold by
Meneses Rodella P and Meneses Napoleon D
Bought by
Naraharisetty Ravi Teja and Chintalapudi Padmanjana Sowmya
Home Financials for this Owner
Home Financials are based on the most recent Mortgage that was taken out on this home.
Original Mortgage
$636,150
Interest Rate
4.3%
Mortgage Type
New Conventional
Purchase Details
Closed on
Dec 23, 2010
Sold by
Wells Fargo Bank Na
Bought by
Meneses Rodella P and Meneses Napoleon D
Home Financials for this Owner
Home Financials are based on the most recent Mortgage that was taken out on this home.
Original Mortgage
$389,860
Interest Rate
4.84%
Mortgage Type
Seller Take Back
Purchase Details
Closed on
Oct 13, 2010
Sold by
Pingul Julilee D and Pingul Crispin M
Bought by
Wells Fargo Bank Na
Purchase Details
Closed on
Sep 25, 2007
Sold by
Adiecha Angela
Bought by
Adiecha Purav
Home Financials for this Owner
Home Financials are based on the most recent Mortgage that was taken out on this home.
Original Mortgage
$504,000
Interest Rate
6.87%
Mortgage Type
Purchase Money Mortgage
Purchase Details
Closed on
Jul 23, 2001
Sold by
Adiecha Vipul
Bought by
Adiecha Purav
Home Financials for this Owner
Home Financials are based on the most recent Mortgage that was taken out on this home.
Original Mortgage
$275,000
Interest Rate
7.15%
Purchase Details
Closed on
Dec 13, 2000
Sold by
Adiecha Angela
Bought by
Adiecha Purav
Home Financials for this Owner
Home Financials are based on the most recent Mortgage that was taken out on this home.
Original Mortgage
$347,300
Interest Rate
7.67%
Mortgage Type
Stand Alone First
Purchase Details
Closed on
Dec 7, 2000
Sold by
Barakos Maria and Petros Nicholas
Bought by
Adiecha Purav and Adiecha Vipul
Home Financials for this Owner
Home Financials are based on the most recent Mortgage that was taken out on this home.
Original Mortgage
$347,300
Interest Rate
7.67%
Mortgage Type
Stand Alone First
Purchase Details
Closed on
Nov 6, 2000
Sold by
Petros Aristea P
Bought by
Barakos Maria and Petros Nicholas
Home Financials for this Owner
Home Financials are based on the most recent Mortgage that was taken out on this home.
Original Mortgage
$347,300
Interest Rate
7.67%
Mortgage Type
Stand Alone First
Create a Home Valuation Report for This Property
The Home Valuation Report is an in-depth analysis detailing your home's value as well as a comparison with similar homes in the area
Home Values in the Area
Average Home Value in this Area
Purchase History
| Date | Buyer | Sale Price | Title Company |
|---|---|---|---|
| Ravi Teja And Padmanjana Revocable Trust | -- | -- | |
| Naraharisetty Ravi Teja | $800,000 | Old Republic Title Company | |
| Meneses Rodella P | $400,000 | Servicelink | |
| Wells Fargo Bank Na | $350,000 | Accommodation | |
| Adiecha Purav | -- | Alliance Title Company | |
| Pingul Julilee D | $630,000 | Alliance Title Company | |
| Adiecha Purav | -- | Chicago Title Co | |
| Adiecha Purav | -- | Chicago Title Co | |
| Adiecha Vipul | -- | Chicago Title Co | |
| Adiecha Purav | $351,000 | Chicago Title Co | |
| Barakos Maria | -- | -- |
Source: Public Records
Mortgage History
| Date | Status | Borrower | Loan Amount |
|---|---|---|---|
| Previous Owner | Naraharisetty Ravi Teja | $636,150 | |
| Previous Owner | Meneses Rodella P | $389,860 | |
| Previous Owner | Pingul Julilee D | $504,000 | |
| Previous Owner | Adiecha Purav | $94,500 | |
| Previous Owner | Adiecha Purav | $275,000 | |
| Previous Owner | Adiecha Purav | $347,300 |
Source: Public Records
Tax History Compared to Growth
Tax History
| Year | Tax Paid | Tax Assessment Tax Assessment Total Assessment is a certain percentage of the fair market value that is determined by local assessors to be the total taxable value of land and additions on the property. | Land | Improvement |
|---|---|---|---|---|
| 2025 | $11,138 | $928,448 | $464,224 | $464,224 |
| 2024 | $11,138 | $910,248 | $455,124 | $455,124 |
| 2023 | $10,842 | $892,400 | $446,200 | $446,200 |
| 2022 | $10,706 | $874,904 | $437,452 | $437,452 |
| 2021 | $10,444 | $857,752 | $428,876 | $428,876 |
| 2020 | $10,485 | $848,960 | $424,480 | $424,480 |
| 2019 | $10,366 | $832,320 | $416,160 | $416,160 |
| 2018 | $10,165 | $816,000 | $408,000 | $408,000 |
| 2017 | $5,657 | $441,555 | $132,466 | $309,089 |
| 2016 | $5,554 | $432,900 | $129,870 | $303,030 |
| 2015 | $5,473 | $426,400 | $127,920 | $298,480 |
| 2014 | $5,374 | $418,047 | $125,414 | $292,633 |
Source: Public Records
Map
Nearby Homes
- 40708 Fremont Blvd
- 40769 Squill Common
- 40469 Shaw Ct
- 4310 Providence Terrace
- 40425 Chapel Way Unit 214
- 40425 Chapel Way Unit 309
- 4214 Providence Terrace
- 40702 Greystone Terrace Unit 9
- 4463 Hyde Common Unit 306
- 4421 Cahill St
- 41212 Fremont Blvd
- 4453 Porter St
- 2851 Finca Terrace
- 39993 Fremont Blvd Unit 102
- 3909 Stevenson Blvd Unit 402
- 3909 Stevenson Blvd Unit 508
- 3695 Stevenson Blvd Unit E206
- 3800 Adams Ave
- 3918 Fossano Common
- 40116 Crockett St
- 3857 Clough Ave
- 3814 James Ave
- 3753 Clough Ave
- 3848 James Ave
- 3778 James Ave
- 3893 Clough Ave
- 3838 Clough Ave
- 3814 Clough Ave
- 3882 James Ave
- 3744 James Ave
- 3862 Clough Ave
- 3770 Clough Ave
- 3886 Clough Ave
- 3931 Clough Ave
- 3746 Clough Ave
- 3729 Clough Ave
- 3918 James Ave
- 3811 James Ave
- 3924 Clough Ave
- 3710 James Ave