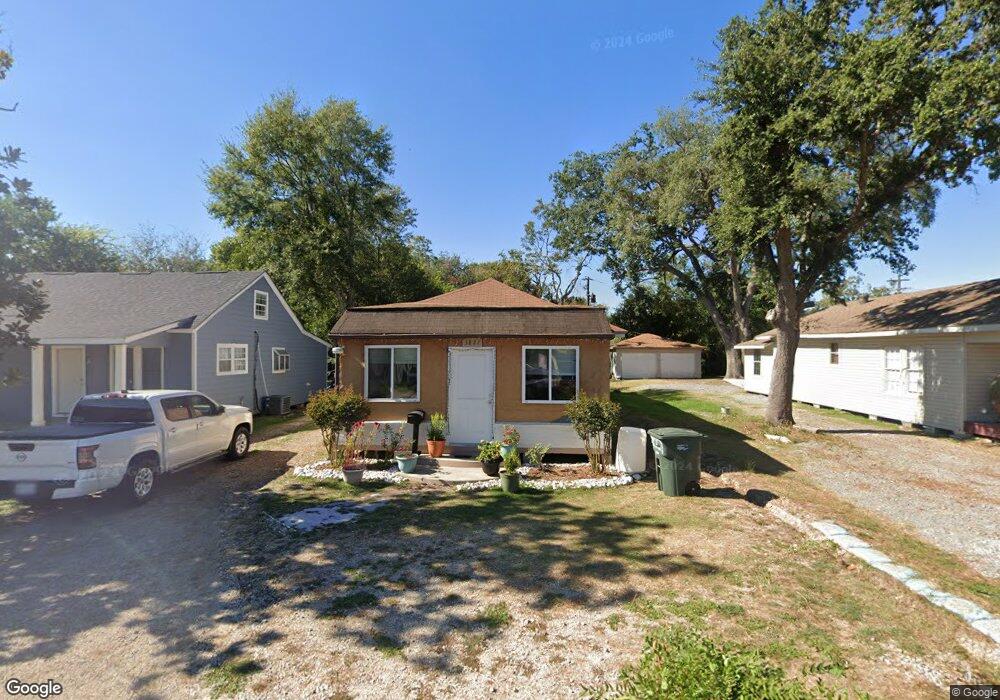
3827 27th St Port Arthur, TX 77642
Estimated Value: $74,000 - $117,000
--
Bed
--
Bath
1,500
Sq Ft
$61/Sq Ft
Est. Value
About This Home
This home is located at 3827 27th St, Port Arthur, TX 77642 and is currently estimated at $90,915, approximately $60 per square foot. 3827 27th St is a home located in Jefferson County with nearby schools including Tyrrell Elementary School, Jefferson Middle School, and Memorial High School.
Ownership History
Date
Name
Owned For
Owner Type
Purchase Details
Closed on
Aug 15, 2017
Sold by
Steinkraus Camille Ragnauth
Bought by
Deonarine Desmond and Deonarine Evelyn
Current Estimated Value
Home Financials for this Owner
Home Financials are based on the most recent Mortgage that was taken out on this home.
Original Mortgage
$43,333
Interest Rate
3.85%
Mortgage Type
New Conventional
Purchase Details
Closed on
Oct 15, 2012
Sold by
Steinkraus Rande Dane
Bought by
Steinkraus Camille Ragnauth
Purchase Details
Closed on
Sep 21, 2010
Sold by
Moore David J
Bought by
Steinkraus Camille Ragnauth and Steinkraus Rande Dane
Purchase Details
Closed on
Nov 22, 2005
Sold by
Cropper Richard J and Cropper Angela
Bought by
Moore David
Purchase Details
Closed on
Mar 20, 2001
Sold by
Leblanc Norbert L
Bought by
Cropper Richard James and Cropper Angela
Create a Home Valuation Report for This Property
The Home Valuation Report is an in-depth analysis detailing your home's value as well as a comparison with similar homes in the area
Home Values in the Area
Average Home Value in this Area
Purchase History
| Date | Buyer | Sale Price | Title Company |
|---|---|---|---|
| Deonarine Desmond | $56,000 | None Available | |
| Steinkraus Camille Ragnauth | -- | None Available | |
| Steinkraus Camille Ragnauth | $7,000 | None Available | |
| Moore David | -- | Jctc | |
| Cropper Richard James | -- | -- |
Source: Public Records
Mortgage History
| Date | Status | Borrower | Loan Amount |
|---|---|---|---|
| Previous Owner | Deonarine Desmond | $43,333 |
Source: Public Records
Tax History Compared to Growth
Tax History
| Year | Tax Paid | Tax Assessment Tax Assessment Total Assessment is a certain percentage of the fair market value that is determined by local assessors to be the total taxable value of land and additions on the property. | Land | Improvement |
|---|---|---|---|---|
| 2025 | $700 | $62,240 | -- | -- |
| 2024 | $700 | $56,582 | -- | -- |
| 2023 | $700 | $51,438 | $0 | $0 |
| 2022 | $1,485 | $46,762 | $0 | $0 |
| 2021 | $1,409 | $53,151 | $1,960 | $51,191 |
| 2020 | $751 | $38,646 | $1,960 | $36,686 |
| 2019 | $1,232 | $38,650 | $1,960 | $36,690 |
| 2018 | $729 | $38,650 | $1,960 | $36,690 |
| 2017 | $1,198 | $38,650 | $1,960 | $36,690 |
| 2016 | $1,132 | $38,650 | $1,960 | $36,690 |
| 2015 | $1,099 | $36,820 | $1,960 | $34,860 |
| 2014 | $1,099 | $35,277 | $1,960 | $34,860 |
Source: Public Records
Map
Nearby Homes
- 3812 30th St
- 2325 Oaklawn Ave
- 4034 32nd St
- 3500 32nd St
- LOT 55 Royal Meadows Estate
- 2621 Evergreen Dr
- 3208 29th St
- 2323 7th Ave
- 2515 Glenwood Dr
- 3200 4th Ave
- 3124 30th St
- 4501 Springdale St
- 3721 Avalon Ave
- 2129 Neches Ave
- 3801 7th Ave
- 3015 25th St
- 3412 Drexel Ave
- 4100 Dryden Rd
- 3836 Lexington Ave
- 3124 Alamo Ave