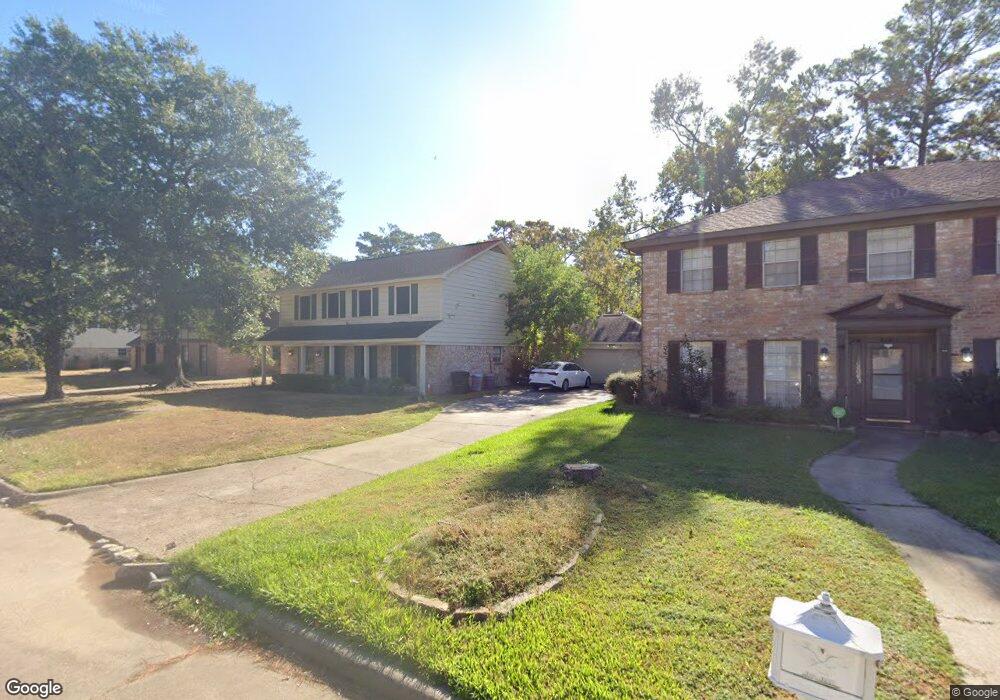
3827 Stillview Dr Houston, TX 77068
Champions NeighborhoodEstimated Value: $283,144 - $301,000
4
Beds
3
Baths
2,500
Sq Ft
$117/Sq Ft
Est. Value
About This Home
This home is located at 3827 Stillview Dr, Houston, TX 77068 and is currently estimated at $291,286, approximately $116 per square foot. 3827 Stillview Dr is a home located in Harris County with nearby schools including Pat Reynolds Elementary School, Edwin M. Wells Middle School, and Westfield High School.
Ownership History
Date
Name
Owned For
Owner Type
Purchase Details
Closed on
Dec 3, 2010
Sold by
Collums Melody G
Bought by
Collums Thomas P
Current Estimated Value
Purchase Details
Closed on
Aug 25, 2000
Sold by
Bell William F and Bell Clemen P
Bought by
Collums Thomas P and Collums Melody G
Home Financials for this Owner
Home Financials are based on the most recent Mortgage that was taken out on this home.
Original Mortgage
$108,944
Outstanding Balance
$39,307
Interest Rate
8.15%
Mortgage Type
FHA
Estimated Equity
$251,979
Purchase Details
Closed on
Mar 19, 1997
Sold by
Mcpherson Donald R
Bought by
Bell William F
Home Financials for this Owner
Home Financials are based on the most recent Mortgage that was taken out on this home.
Original Mortgage
$96,000
Interest Rate
7.65%
Mortgage Type
Seller Take Back
Create a Home Valuation Report for This Property
The Home Valuation Report is an in-depth analysis detailing your home's value as well as a comparison with similar homes in the area
Home Values in the Area
Average Home Value in this Area
Purchase History
| Date | Buyer | Sale Price | Title Company |
|---|---|---|---|
| Collums Thomas P | -- | None Available | |
| Collums Thomas P | -- | First American Title | |
| Bell William F | -- | -- |
Source: Public Records
Mortgage History
| Date | Status | Borrower | Loan Amount |
|---|---|---|---|
| Open | Collums Thomas P | $108,944 | |
| Previous Owner | Bell William F | $96,000 |
Source: Public Records
Tax History Compared to Growth
Tax History
| Year | Tax Paid | Tax Assessment Tax Assessment Total Assessment is a certain percentage of the fair market value that is determined by local assessors to be the total taxable value of land and additions on the property. | Land | Improvement |
|---|---|---|---|---|
| 2025 | $3,378 | $234,398 | $50,544 | $183,854 |
| 2024 | $3,378 | $260,187 | $50,544 | $209,643 |
| 2023 | $3,378 | $260,187 | $47,268 | $212,919 |
| 2022 | $4,049 | $220,000 | $47,268 | $172,732 |
| 2021 | $3,861 | $157,000 | $21,271 | $135,729 |
| 2020 | $5,453 | $209,012 | $21,271 | $187,741 |
| 2019 | $5,200 | $191,996 | $21,271 | $170,725 |
| 2018 | $5,362 | $177,555 | $21,271 | $156,284 |
| 2017 | $4,746 | $177,555 | $21,271 | $156,284 |
| 2016 | $4,539 | $169,816 | $21,271 | $148,545 |
| 2015 | $3,937 | $153,982 | $21,271 | $132,711 |
| 2014 | $3,937 | $141,818 | $21,271 | $120,547 |
Source: Public Records
Map
Nearby Homes
- 3918 Stillview Dr
- 3902 Glenheather Dr
- 3915 Glenheather Dr
- 14350 Persimmon Woods Dr
- 15007 Pebble Bend Dr
- 14203 Broad Cypress Ct
- 14907 Walters Rd
- 14911 Walters Rd
- 15007 Walters Rd
- 4118 Streambed Trail
- 15026 Falling Creek Dr
- 4118 Lake Cypress Cir
- 3838 Gladeridge Dr
- 3834 Gladeridge Dr
- 3615 Highfalls Dr
- 15119 Pebble Bend Dr
- 3818 Gladeridge Dr
- 3822 Blue Spring Dr
- 4211 False Cypress Ln
- 4215 False Cypress Ln
- 3831 Stillview Dr
- 3823 Stillview Dr
- 3826 Midforest Dr
- 3818 Midforest Dr
- 3819 Stillview Dr
- 3830 Stillview Dr
- 3826 Stillview Dr
- 3834 Stillview Dr
- 3903 Stillview Dr
- 3814 Midforest Dr
- 3902 Midforest Dr
- 3822 Stillview Dr
- 3818 Stillview Dr
- 3902 Stillview Dr
- 3906 Midforest Dr
- 3831 Fernglade Dr
- 3823 Midforest Dr
- 3827 Midforest Dr
- 3907 Stillview Dr
- 3810 Midforest Dr