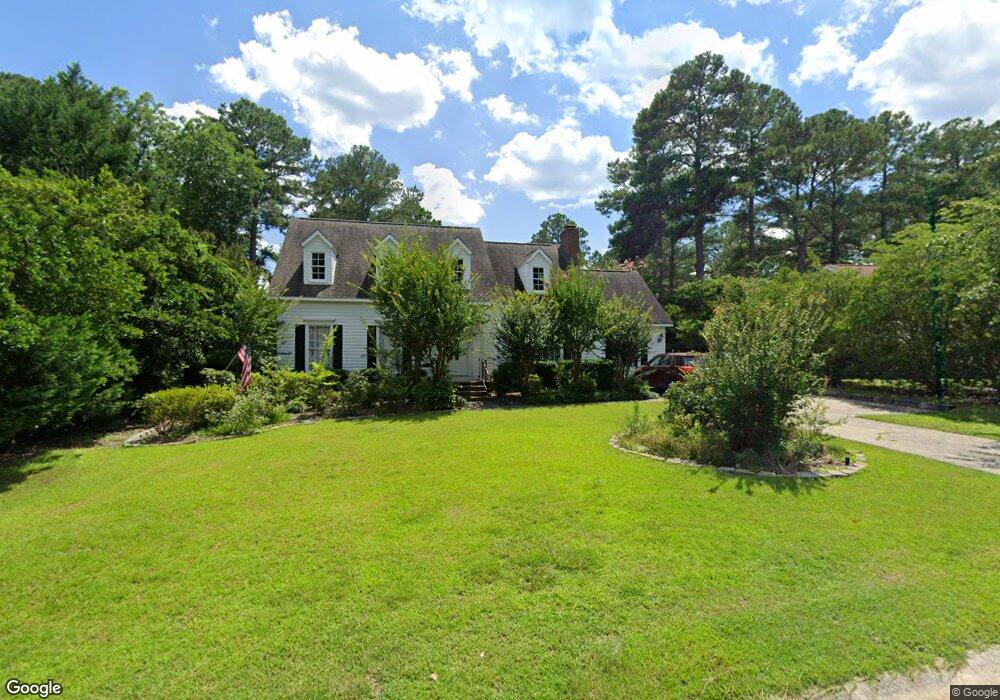
3829 Clearwater Dr Fayetteville, NC 28311
Brookwood NeighborhoodEstimated Value: $247,000 - $333,735
3
Beds
4
Baths
2,237
Sq Ft
$129/Sq Ft
Est. Value
About This Home
This home is located at 3829 Clearwater Dr, Fayetteville, NC 28311 and is currently estimated at $289,434, approximately $129 per square foot. 3829 Clearwater Dr is a home located in Cumberland County with nearby schools including Warrenwood Elementary, Luther Nick Jeralds Middle School, and E. E. Smith High School.
Ownership History
Date
Name
Owned For
Owner Type
Purchase Details
Closed on
May 2, 2024
Sold by
Maris Group Llc
Bought by
Hill Camille Elyse
Current Estimated Value
Home Financials for this Owner
Home Financials are based on the most recent Mortgage that was taken out on this home.
Original Mortgage
$340,000
Outstanding Balance
$335,251
Interest Rate
6.9%
Mortgage Type
New Conventional
Estimated Equity
-$45,817
Purchase Details
Closed on
Aug 24, 2022
Sold by
Trioaks Capital Llc
Bought by
Maris Group Llc
Purchase Details
Closed on
Nov 8, 2017
Sold by
Duarte Jason S
Bought by
Duarte Carlos
Purchase Details
Closed on
Jul 21, 2014
Sold by
Duarte Carlos
Bought by
Duarte Jason S
Purchase Details
Closed on
May 15, 2001
Sold by
Poland Charles H
Bought by
Duarte Carlos
Home Financials for this Owner
Home Financials are based on the most recent Mortgage that was taken out on this home.
Original Mortgage
$125,000
Interest Rate
7.05%
Create a Home Valuation Report for This Property
The Home Valuation Report is an in-depth analysis detailing your home's value as well as a comparison with similar homes in the area
Home Values in the Area
Average Home Value in this Area
Purchase History
| Date | Buyer | Sale Price | Title Company |
|---|---|---|---|
| Hill Camille Elyse | $340,000 | None Listed On Document | |
| Maris Group Llc | $174,000 | Lowry Stephen D | |
| Maris Group Llc | $174,000 | Lowry Stephen D | |
| Trioaks Capital Llc | $150,000 | Bridgetrust Title | |
| Trioaks Capital Llc | $150,000 | Bridgetrust Title | |
| Duarte Carlos | -- | None Available | |
| Duarte Jason S | -- | -- | |
| Duarte Carlos | $125,000 | -- |
Source: Public Records
Mortgage History
| Date | Status | Borrower | Loan Amount |
|---|---|---|---|
| Open | Hill Camille Elyse | $340,000 | |
| Previous Owner | Duarte Carlos | $125,000 |
Source: Public Records
Tax History Compared to Growth
Tax History
| Year | Tax Paid | Tax Assessment Tax Assessment Total Assessment is a certain percentage of the fair market value that is determined by local assessors to be the total taxable value of land and additions on the property. | Land | Improvement |
|---|---|---|---|---|
| 2024 | $3,326 | $148,367 | $25,000 | $123,367 |
| 2023 | $2,477 | $148,367 | $25,000 | $123,367 |
| 2022 | $2,225 | $148,367 | $25,000 | $123,367 |
| 2021 | $2,225 | $148,367 | $25,000 | $123,367 |
| 2019 | $2,190 | $144,200 | $25,000 | $119,200 |
| 2018 | $2,190 | $144,200 | $25,000 | $119,200 |
| 2017 | $2,087 | $144,200 | $25,000 | $119,200 |
| 2016 | $2,138 | $161,400 | $23,000 | $138,400 |
| 2015 | $2,116 | $161,400 | $23,000 | $138,400 |
| 2014 | $1,557 | $161,400 | $23,000 | $138,400 |
Source: Public Records
Map
Nearby Homes
- 3825 Clearwater Dr
- 3831 Clearwater Dr
- 3826 Clearwater Dr
- 3828 Clearwater Dr
- 3821 Clearwater Dr
- 3634 Thorndike Dr
- 3830 Clearwater Dr
- 3824 Clearwater Dr
- 3639 Thorndike Dr
- 3635 Thorndike Dr
- 3813 Ithaca Place
- 3641 Thorndike Dr
- 3819 Clearwater Dr
- 3643 Thorndike Dr
- 3630 Thorndike Dr
- 3814 Ithaca Place
- 3822 Clearwater Dr
- 3629 Thorndike Dr
- 3900 Clearwater Dr
- 3625 Thorndike Dr