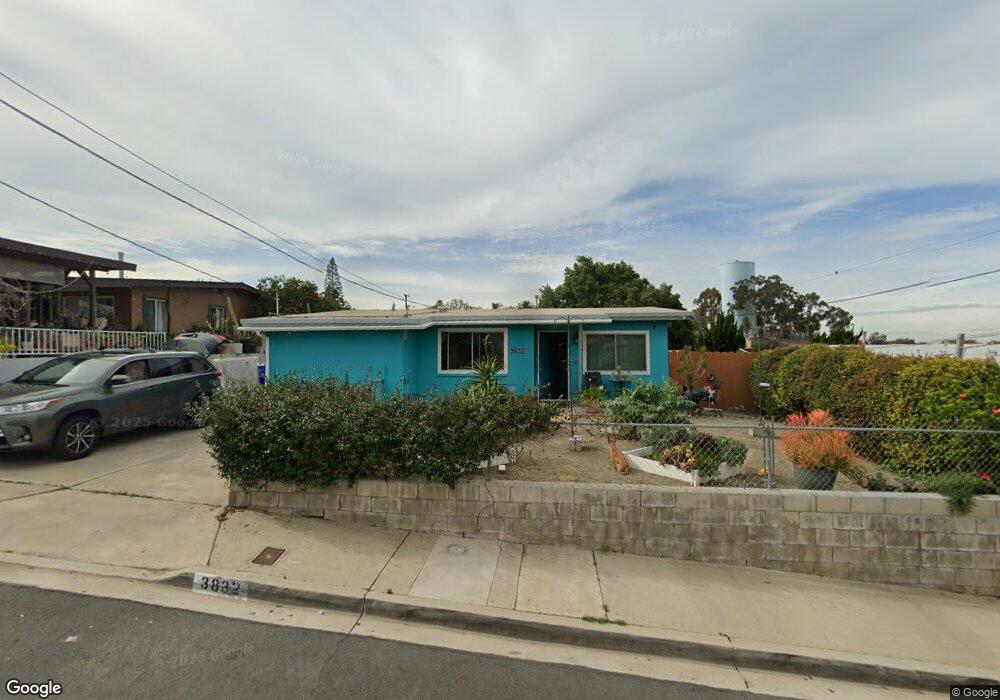
3832 Gayle St San Diego, CA 92115
Redwood Village NeighborhoodEstimated Value: $722,216 - $778,000
3
Beds
1
Bath
1,044
Sq Ft
$714/Sq Ft
Est. Value
About This Home
This home is located at 3832 Gayle St, San Diego, CA 92115 and is currently estimated at $745,304, approximately $713 per square foot. 3832 Gayle St is a home located in San Diego County with nearby schools including Carver Elementary School, Mann Middle School, and Crawford High School.
Ownership History
Date
Name
Owned For
Owner Type
Purchase Details
Closed on
Jun 12, 2025
Sold by
Rammel Amber
Bought by
Rammel Scott Robert
Current Estimated Value
Purchase Details
Closed on
Nov 19, 2019
Sold by
Rammel Scott and Rammel Amber
Bought by
Rammel Amber N and Rammel Scott R
Home Financials for this Owner
Home Financials are based on the most recent Mortgage that was taken out on this home.
Original Mortgage
$352,000
Interest Rate
3.5%
Purchase Details
Closed on
Jan 16, 2015
Sold by
Belote John and Mann Belote Michele
Bought by
Rammel Scott and Rammel Amber
Home Financials for this Owner
Home Financials are based on the most recent Mortgage that was taken out on this home.
Original Mortgage
$318,250
Interest Rate
3.76%
Mortgage Type
New Conventional
Purchase Details
Closed on
Nov 14, 2013
Sold by
Belote John and Mann Belote Michele
Bought by
Belote John and Mann Belote Michele
Purchase Details
Closed on
Apr 9, 1992
Bought by
Belote John Mann-Belote Michele
Purchase Details
Closed on
Mar 20, 1987
Create a Home Valuation Report for This Property
The Home Valuation Report is an in-depth analysis detailing your home's value as well as a comparison with similar homes in the area
Home Values in the Area
Average Home Value in this Area
Purchase History
| Date | Buyer | Sale Price | Title Company |
|---|---|---|---|
| Rammel Scott Robert | -- | None Listed On Document | |
| Rammel Amber N | -- | Wfg National Title Company | |
| Rammel Scott | $335,000 | First American Title | |
| Belote John | -- | None Available | |
| Belote John Mann-Belote Michele | $114,200 | -- | |
| -- | $79,900 | -- |
Source: Public Records
Mortgage History
| Date | Status | Borrower | Loan Amount |
|---|---|---|---|
| Previous Owner | Rammel Amber N | $352,000 | |
| Previous Owner | Rammel Scott | $318,250 |
Source: Public Records
Tax History Compared to Growth
Tax History
| Year | Tax Paid | Tax Assessment Tax Assessment Total Assessment is a certain percentage of the fair market value that is determined by local assessors to be the total taxable value of land and additions on the property. | Land | Improvement |
|---|---|---|---|---|
| 2025 | $4,797 | $402,609 | $183,329 | $219,280 |
| 2024 | $4,797 | $394,716 | $179,735 | $214,981 |
| 2023 | $4,689 | $386,977 | $176,211 | $210,766 |
| 2022 | $4,562 | $379,390 | $172,756 | $206,634 |
| 2021 | $4,530 | $371,952 | $169,369 | $202,583 |
| 2020 | $4,474 | $368,139 | $167,633 | $200,506 |
| 2019 | $4,393 | $360,922 | $164,347 | $196,575 |
| 2018 | $4,107 | $353,846 | $161,125 | $192,721 |
| 2017 | $4,007 | $346,909 | $157,966 | $188,943 |
| 2016 | $3,941 | $340,108 | $154,869 | $185,239 |
| 2015 | $2,145 | $180,093 | $82,006 | $98,087 |
| 2014 | $2,112 | $176,566 | $80,400 | $96,166 |
Source: Public Records
Map
Nearby Homes
- 3885 Demus St
- 6180 Kerch St
- 5990 Dandridge Ln Unit 187
- 5990 Dandridge Ln Unit 198
- 3980 60th St Unit 37
- 5980 Dandridge Ln Unit 215
- 5985 Dandridge Ln Unit 103
- 3955 Faircross Place Unit 60
- 3489 Glade St
- 3930 60th St Unit 171
- 3934 60th St Unit 158
- 3803 Billman St
- 3980 Faircross Place Unit 11
- 3980 Faircross Place Unit 32
- 4259 View Place
- 6143 Tarragona Dr
- 6310 Thorn St
- 4281 College Ave
- 5763 Streamview Dr
- 6544 College Grove Dr Unit 68