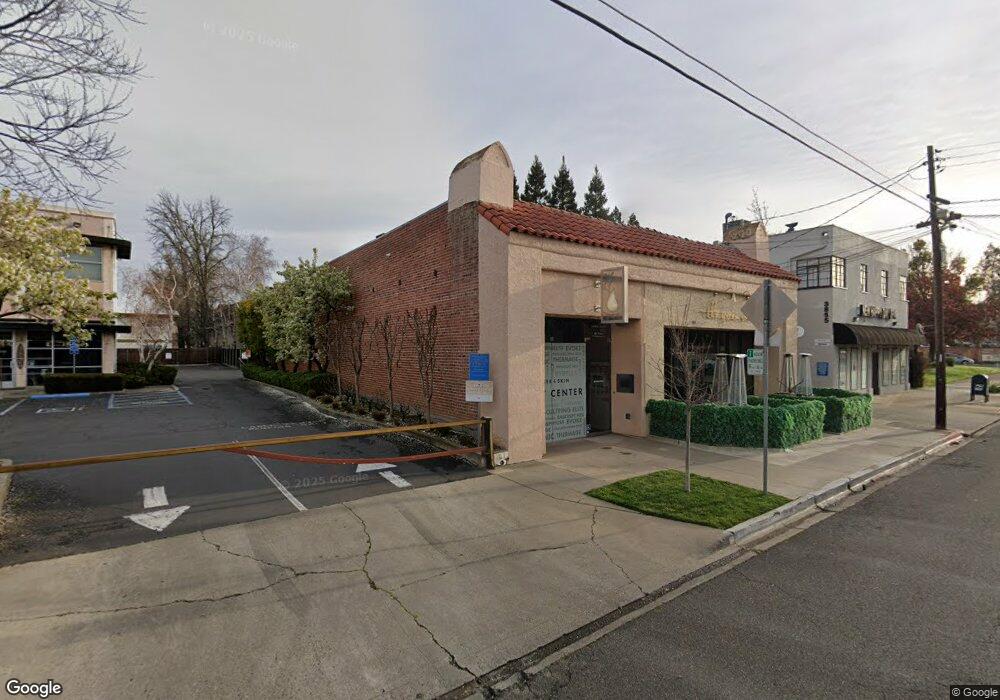
3837 J St Sacramento, CA 95816
East Sacramento NeighborhoodEstimated Value: $1,351,208
--
Bed
--
Bath
3,900
Sq Ft
$346/Sq Ft
Est. Value
About This Home
This home is located at 3837 J St, Sacramento, CA 95816 and is currently estimated at $1,351,208, approximately $346 per square foot. 3837 J St is a home located in Sacramento County with nearby schools including David Lubin Elementary, Miwok Middle School, and Hiram W. Johnson High School.
Ownership History
Date
Name
Owned For
Owner Type
Purchase Details
Closed on
Jun 28, 2007
Sold by
Fahn Nancy M
Bought by
Fahn Kenneth M
Current Estimated Value
Purchase Details
Closed on
Dec 12, 2001
Sold by
Fahn Nancy M
Bought by
Fahn Kenneth M
Home Financials for this Owner
Home Financials are based on the most recent Mortgage that was taken out on this home.
Original Mortgage
$415,000
Outstanding Balance
$159,995
Interest Rate
6.39%
Mortgage Type
Seller Take Back
Estimated Equity
$1,191,213
Purchase Details
Closed on
Oct 17, 2000
Sold by
Kumasaki Dorothy and Kumasaki Edward
Bought by
Owyang Dr Hing and Owyang Helen F
Create a Home Valuation Report for This Property
The Home Valuation Report is an in-depth analysis detailing your home's value as well as a comparison with similar homes in the area
Home Values in the Area
Average Home Value in this Area
Purchase History
| Date | Buyer | Sale Price | Title Company |
|---|---|---|---|
| Fahn Kenneth M | -- | Fidelity National Title Co | |
| Fahn Kenneth M | -- | Placer Title Company | |
| Fahn Kenneth M | $465,000 | Placer Title Company | |
| Owyang Dr Hing | $425,000 | Placer Title Company |
Source: Public Records
Mortgage History
| Date | Status | Borrower | Loan Amount |
|---|---|---|---|
| Open | Fahn Kenneth M | $415,000 |
Source: Public Records
Tax History Compared to Growth
Tax History
| Year | Tax Paid | Tax Assessment Tax Assessment Total Assessment is a certain percentage of the fair market value that is determined by local assessors to be the total taxable value of land and additions on the property. | Land | Improvement |
|---|---|---|---|---|
| 2025 | $8,256 | $686,924 | $295,451 | $391,473 |
| 2024 | $8,256 | $673,456 | $289,658 | $383,798 |
| 2023 | $8,063 | $660,252 | $283,979 | $376,273 |
| 2022 | $7,928 | $647,307 | $278,411 | $368,896 |
| 2021 | $7,558 | $634,615 | $272,952 | $361,663 |
| 2020 | $7,618 | $628,109 | $270,154 | $357,955 |
| 2019 | $7,458 | $615,794 | $264,857 | $350,937 |
| 2018 | $7,268 | $603,720 | $259,664 | $344,056 |
| 2017 | $7,172 | $591,883 | $254,573 | $337,310 |
| 2016 | $6,818 | $580,279 | $249,582 | $330,697 |
| 2015 | $6,720 | $571,564 | $245,834 | $325,730 |
| 2014 | $6,538 | $560,369 | $241,019 | $319,350 |
Source: Public Records
Map
Nearby Homes