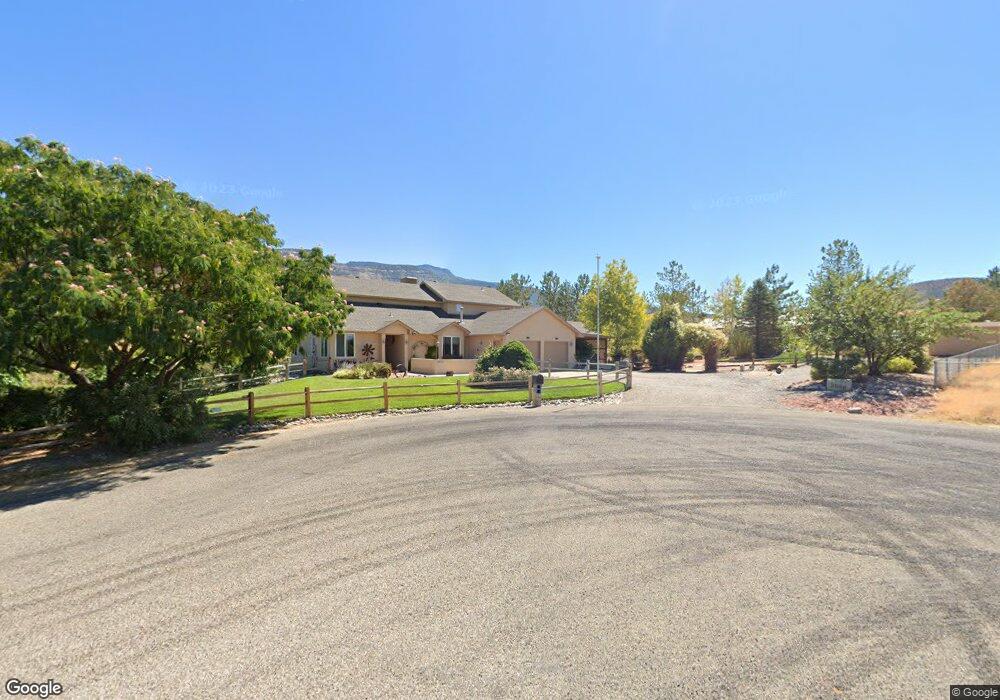
3846 Caballo Ct Palisade, CO 81526
East Orchard Mesa NeighborhoodEstimated Value: $679,439 - $927,000
3
Beds
3
Baths
2,566
Sq Ft
$319/Sq Ft
Est. Value
About This Home
This home is located at 3846 Caballo Ct, Palisade, CO 81526 and is currently estimated at $817,610, approximately $318 per square foot. 3846 Caballo Ct is a home located in Mesa County with nearby schools including Taylor Elementary School, Mount Garfield Middle School, and Palisade High School.
Ownership History
Date
Name
Owned For
Owner Type
Purchase Details
Closed on
Oct 21, 2014
Sold by
Skinner James Truman and Skinner Shirley Ann
Bought by
Skinner James Truman and Skinn Shirley Ann
Current Estimated Value
Purchase Details
Closed on
Sep 11, 2000
Sold by
Skinner James T
Bought by
Skinner James T and Skinner Shirley A
Home Financials for this Owner
Home Financials are based on the most recent Mortgage that was taken out on this home.
Original Mortgage
$110,900
Outstanding Balance
$40,591
Interest Rate
8.16%
Estimated Equity
$777,019
Purchase Details
Closed on
Sep 8, 2000
Sold by
Saunders Bruce L
Bought by
Skinner James T
Home Financials for this Owner
Home Financials are based on the most recent Mortgage that was taken out on this home.
Original Mortgage
$110,900
Outstanding Balance
$40,591
Interest Rate
8.16%
Estimated Equity
$777,019
Purchase Details
Closed on
Jan 11, 2000
Sold by
Saunders Eva M
Bought by
Saunders Bruce L
Purchase Details
Closed on
Mar 27, 1991
Sold by
Edgington Gary L
Bought by
Skinner James Truman and Skinner Shirley
Create a Home Valuation Report for This Property
The Home Valuation Report is an in-depth analysis detailing your home's value as well as a comparison with similar homes in the area
Home Values in the Area
Average Home Value in this Area
Purchase History
| Date | Buyer | Sale Price | Title Company |
|---|---|---|---|
| Skinner James Truman | -- | None Available | |
| Skinner James T | -- | -- | |
| Skinner James T | $222,000 | Abstract & Title Company | |
| Saunders Bruce L | -- | -- | |
| Skinner James Truman | $19,600 | -- |
Source: Public Records
Mortgage History
| Date | Status | Borrower | Loan Amount |
|---|---|---|---|
| Open | Skinner James T | $110,900 | |
| Closed | Skinner James T | $100,000 |
Source: Public Records
Tax History Compared to Growth
Tax History
| Year | Tax Paid | Tax Assessment Tax Assessment Total Assessment is a certain percentage of the fair market value that is determined by local assessors to be the total taxable value of land and additions on the property. | Land | Improvement |
|---|---|---|---|---|
| 2024 | $1,823 | $34,290 | $8,470 | $25,820 |
| 2023 | $1,823 | $34,290 | $8,470 | $25,820 |
| 2022 | $1,804 | $26,760 | $6,810 | $19,950 |
| 2021 | $1,810 | $27,530 | $7,010 | $20,520 |
| 2020 | $1,571 | $24,520 | $5,150 | $19,370 |
| 2019 | $1,480 | $24,520 | $5,150 | $19,370 |
| 2018 | $1,659 | $25,790 | $4,680 | $21,110 |
| 2017 | $1,655 | $25,790 | $4,680 | $21,110 |
| 2016 | $1,549 | $27,550 | $4,380 | $23,170 |
| 2015 | $1,568 | $27,550 | $4,380 | $23,170 |
| 2014 | $1,565 | $27,690 | $4,380 | $23,310 |
Source: Public Records
Map
Nearby Homes
- 3858 Puerta Vista Ct
- 314 33 1 2 Rd
- 589 39 Rd
- 585 39 Rd
- 3781 Granada Dr Unit 4
- 3781 Granada Dr Unit 3
- 679 Brentwood Dr Unit 2
- 139 W 6th St
- 845 Logan St
- 122 W 5th St
- 828 Logan Ct
- 846 Cabernet Dr
- 819 Elberta Ave
- 125 E 1st St
- 872 Montclair Dr
- 512 Crawford Ln
- 745 Fairhaven Rd
- 532 Crawford Ln
- 3694 F Rd
- 548 Crawford Ln
- 3844 Pomar Vista Ct
- 3842 Caballo Ct
- 3839 Caballo Ct
- 3845 Pomar Vista Ct
- 3842 Pomar Vista Ct
- 3840 Caballo Ct
- 3843 Pomar Vista Ct
- 616 Sobre El Rio Dr
- 3838 Caballo Ct
- 3833 Caballo Ct
- 622 Sobre El Rio Dr
- 612 Sobre El Rio Dr
- 0 Caballo Ct
- 3854 Montana Vista Ct
- 617 Sobre El Rio Dr
- 632 Aldrea Vista Ct
- 608 Sobre El Rio Dr
- 623 Sobre El Rio Dr
- 3830 Caballo Ct
- 631 Aldrea Vista Ct