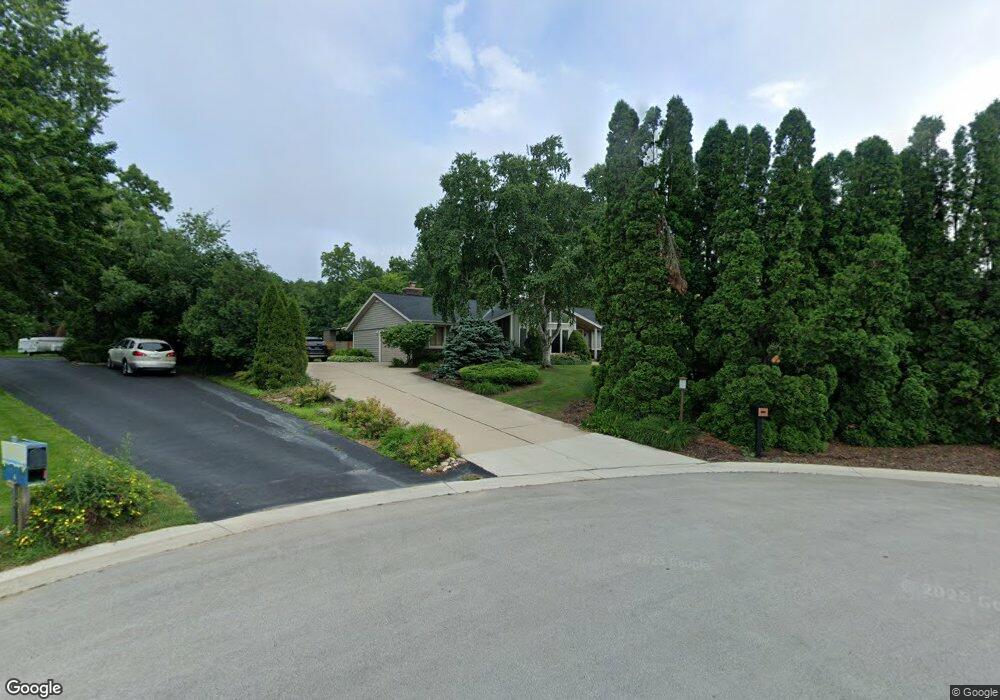
3850 Abbey Ct Brookfield, WI 53045
Estimated Value: $482,000 - $625,000
3
Beds
3
Baths
1,970
Sq Ft
$276/Sq Ft
Est. Value
About This Home
This home is located at 3850 Abbey Ct, Brookfield, WI 53045 and is currently estimated at $544,134, approximately $276 per square foot. 3850 Abbey Ct is a home located in Waukesha County with nearby schools including Burleigh Elementary School, Pilgrim Park Middle School, and Brookfield East High School.
Ownership History
Date
Name
Owned For
Owner Type
Purchase Details
Closed on
Sep 19, 2012
Sold by
Fannie Mae
Bought by
Rogers John H and Rogers Erica J
Current Estimated Value
Home Financials for this Owner
Home Financials are based on the most recent Mortgage that was taken out on this home.
Original Mortgage
$234,500
Outstanding Balance
$162,341
Interest Rate
3.58%
Mortgage Type
New Conventional
Estimated Equity
$381,793
Purchase Details
Closed on
Aug 22, 2011
Sold by
Spanuello Jane M and Spanuello Leo T
Bought by
Federal National Mortgage Association
Purchase Details
Closed on
Oct 23, 2000
Sold by
Hanish Lance G and Hanish Ellen F
Bought by
Spanuello Leo T and Spanuello Jane M
Home Financials for this Owner
Home Financials are based on the most recent Mortgage that was taken out on this home.
Original Mortgage
$173,400
Interest Rate
7.96%
Mortgage Type
Purchase Money Mortgage
Create a Home Valuation Report for This Property
The Home Valuation Report is an in-depth analysis detailing your home's value as well as a comparison with similar homes in the area
Home Values in the Area
Average Home Value in this Area
Purchase History
| Date | Buyer | Sale Price | Title Company |
|---|---|---|---|
| Rogers John H | -- | None Available | |
| Federal National Mortgage Association | -- | None Available | |
| Spanuello Leo T | $216,900 | -- |
Source: Public Records
Mortgage History
| Date | Status | Borrower | Loan Amount |
|---|---|---|---|
| Open | Rogers John H | $234,500 | |
| Previous Owner | Spanuello Leo T | $173,400 |
Source: Public Records
Tax History Compared to Growth
Tax History
| Year | Tax Paid | Tax Assessment Tax Assessment Total Assessment is a certain percentage of the fair market value that is determined by local assessors to be the total taxable value of land and additions on the property. | Land | Improvement |
|---|---|---|---|---|
| 2024 | $4,540 | $410,300 | $144,500 | $265,800 |
| 2023 | $4,538 | $410,300 | $144,500 | $265,800 |
| 2022 | $4,465 | $316,300 | $139,100 | $177,200 |
| 2021 | $4,726 | $316,300 | $139,100 | $177,200 |
| 2020 | $4,944 | $316,300 | $139,100 | $177,200 |
| 2019 | $4,744 | $316,300 | $139,100 | $177,200 |
| 2018 | $4,234 | $275,500 | $120,000 | $155,500 |
| 2017 | $4,246 | $275,500 | $120,000 | $155,500 |
| 2016 | $4,308 | $275,500 | $120,000 | $155,500 |
| 2015 | $4,287 | $275,500 | $120,000 | $155,500 |
| 2014 | $4,560 | $275,500 | $120,000 | $155,500 |
| 2013 | $4,560 | $275,500 | $120,000 | $155,500 |
Source: Public Records
Map
Nearby Homes
- 3810 Mountain Dr
- 3930 St Andrew Ct Unit D
- 18675 Saint Andrew Ln Unit B
- 3580 Hollywood Ln
- 18840 Saratoga Ct
- 18570 Kamala Ct Unit 18550
- 18625 Lola Dr
- 19075 Thomson Dr Unit 304
- 19155 Thomson Dr Unit 304
- 17725 Caribou Pass Unit D
- 3365 Arroyo Rd
- 4265 Williams Ct
- 4355 Continental Ct
- 19475 Summerhill Ln
- 17615 Continental Dr
- 3040 N 186th St Unit 1
- 3030 N 186th St Unit 2
- 3000 N 186th St Unit 6
- 4580 Somerset Ln
- 18530 Pleasant St
- 3870 Abbey Ct
- 18450 Abbey Ln
- 18500 Abbey Ln
- 3820 Abbey Ct
- 3835 Mountain Dr
- 3855 Mountain Dr
- 3890 Abbey Ct
- 3815 Mountain Dr
- 3855 Abbey Ct
- 3845 Abbey Ct
- 3905 Abbey Ct
- 3740 San Fernando Dr
- 3735 San Fernando Dr
- 18555 Abbey Ln
- 3765 Mountain Dr
- 18345 Parish Dr
- 3905 Mountain Dr
- 3870 Long Grove Rd
- 18595 Abbey Ln
- 3910 Long Grove Rd