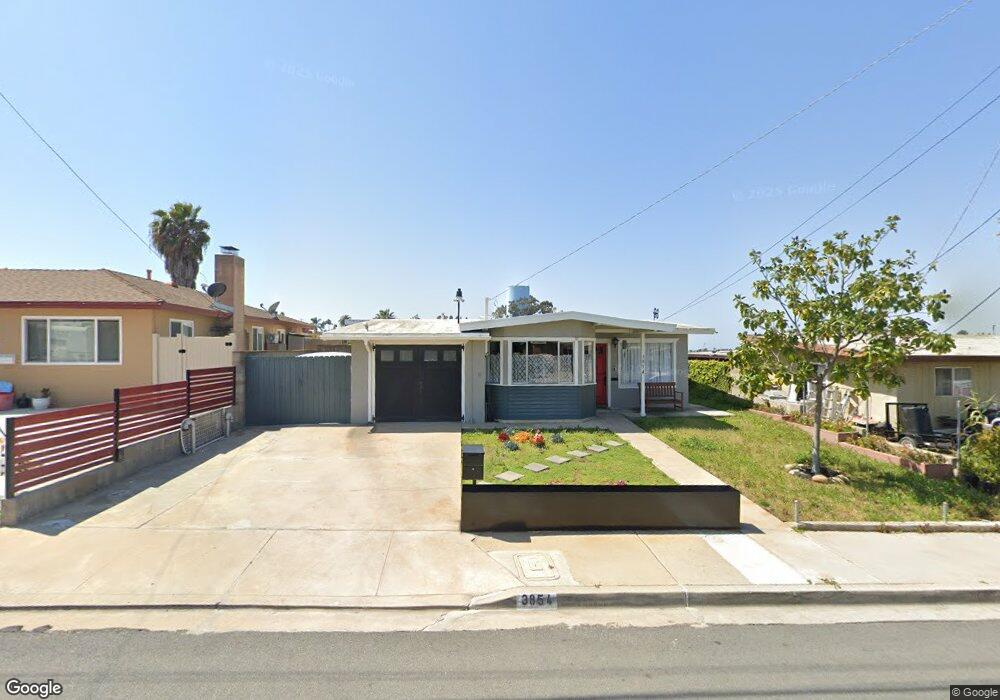
3854 Boren St San Diego, CA 92115
Redwood Village NeighborhoodEstimated Value: $668,757 - $772,000
3
Beds
1
Bath
975
Sq Ft
$739/Sq Ft
Est. Value
About This Home
This home is located at 3854 Boren St, San Diego, CA 92115 and is currently estimated at $720,439, approximately $738 per square foot. 3854 Boren St is a home located in San Diego County with nearby schools including Carver Elementary School, Mann Middle School, and Crawford High School.
Ownership History
Date
Name
Owned For
Owner Type
Purchase Details
Closed on
Apr 20, 2022
Sold by
Blackjack Helgeson Waylon and Blackjack Karina J
Bought by
Helgesonfamily Trust
Current Estimated Value
Purchase Details
Closed on
Dec 9, 2019
Sold by
Helgeson Waylon and Helgeson Karina J
Bought by
Helgeson Waylon Blackjack and Helgeson Karina J
Home Financials for this Owner
Home Financials are based on the most recent Mortgage that was taken out on this home.
Original Mortgage
$350,000
Interest Rate
3.7%
Mortgage Type
New Conventional
Purchase Details
Closed on
Aug 28, 2012
Sold by
Helgeson Waylon
Bought by
Helgeson Waylon and Helgeson Karina J
Home Financials for this Owner
Home Financials are based on the most recent Mortgage that was taken out on this home.
Original Mortgage
$220,210
Interest Rate
3.47%
Mortgage Type
VA
Purchase Details
Closed on
Dec 9, 2011
Sold by
Helgeson Waylon
Bought by
Helgeson Waylon and Helgeson Karina J
Home Financials for this Owner
Home Financials are based on the most recent Mortgage that was taken out on this home.
Original Mortgage
$224,555
Interest Rate
3.94%
Mortgage Type
VA
Purchase Details
Closed on
Sep 15, 2010
Sold by
Federal National Mortgage Association
Bought by
Helgeson Waylon
Home Financials for this Owner
Home Financials are based on the most recent Mortgage that was taken out on this home.
Original Mortgage
$229,800
Interest Rate
4.45%
Mortgage Type
VA
Purchase Details
Closed on
Feb 26, 2010
Sold by
Howell Leonard D
Bought by
Federal National Mortgage Association
Purchase Details
Closed on
Feb 14, 2006
Sold by
Howell Florence C
Bought by
Howell Leonard D
Home Financials for this Owner
Home Financials are based on the most recent Mortgage that was taken out on this home.
Original Mortgage
$105,000
Interest Rate
5.69%
Mortgage Type
Credit Line Revolving
Purchase Details
Closed on
Feb 7, 2006
Sold by
Howell Leonard D
Bought by
Howell Leonard D and Howell Florence C
Home Financials for this Owner
Home Financials are based on the most recent Mortgage that was taken out on this home.
Original Mortgage
$105,000
Interest Rate
5.69%
Mortgage Type
Credit Line Revolving
Purchase Details
Closed on
Apr 13, 1994
Sold by
Howell Leonard Delmater and Howell Florence C
Bought by
Howell Leonard D and Howell Florence C
Create a Home Valuation Report for This Property
The Home Valuation Report is an in-depth analysis detailing your home's value as well as a comparison with similar homes in the area
Home Values in the Area
Average Home Value in this Area
Purchase History
| Date | Buyer | Sale Price | Title Company |
|---|---|---|---|
| Helgesonfamily Trust | -- | Sandke M Tami | |
| Helgeson Waylon Blackjack | -- | Lawyers Title Sd | |
| Helgeson Waylon | -- | Lawyers Title | |
| Helgeson Waylon | -- | Lawyers Title Sd | |
| Helgeson Waylon | -- | Lawyers Title Sd | |
| Helgeson Waylon | -- | Lawyers Title Sd | |
| Helgeson Waylon | $225,000 | Lawyers Title Company | |
| Federal National Mortgage Association | $327,243 | Old Republic Title | |
| Howell Leonard D | -- | Commonwealth Land Title Co | |
| Howell Leonard D | -- | Commonwealth Land Title Co | |
| Howell Leonard D | -- | Commonwealth Land Title Co | |
| Howell Leonard D | -- | -- |
Source: Public Records
Mortgage History
| Date | Status | Borrower | Loan Amount |
|---|---|---|---|
| Previous Owner | Helgeson Waylon Blackjack | $350,000 | |
| Previous Owner | Helgeson Waylon | $220,210 | |
| Previous Owner | Helgeson Waylon | $224,555 | |
| Previous Owner | Helgeson Waylon | $229,800 | |
| Previous Owner | Howell Leonard D | $105,000 | |
| Previous Owner | Howell Leonard D | $322,000 | |
| Previous Owner | Howell Leonard D | $322,000 |
Source: Public Records
Tax History Compared to Growth
Tax History
| Year | Tax Paid | Tax Assessment Tax Assessment Total Assessment is a certain percentage of the fair market value that is determined by local assessors to be the total taxable value of land and additions on the property. | Land | Improvement |
|---|---|---|---|---|
| 2025 | $3,420 | $288,251 | $153,735 | $134,516 |
| 2024 | $3,420 | $282,600 | $150,721 | $131,879 |
| 2023 | $3,342 | $277,060 | $147,766 | $129,294 |
| 2022 | $3,252 | $271,628 | $144,869 | $126,759 |
| 2021 | $3,228 | $266,303 | $142,029 | $124,274 |
| 2020 | $3,188 | $263,573 | $140,573 | $123,000 |
| 2019 | $3,130 | $258,406 | $137,817 | $120,589 |
| 2018 | $2,926 | $253,340 | $135,115 | $118,225 |
| 2017 | $80 | $248,373 | $132,466 | $115,907 |
| 2016 | $2,807 | $243,504 | $129,869 | $113,635 |
| 2015 | $2,765 | $239,848 | $127,919 | $111,929 |
| 2014 | $2,720 | $235,151 | $125,414 | $109,737 |
Source: Public Records
Map
Nearby Homes
- 3885 Demus St
- 6180 Kerch St
- 3980 60th St Unit 37
- 5990 Dandridge Ln Unit 187
- 5990 Dandridge Ln Unit 198
- 5980 Dandridge Ln Unit 215
- 5985 Dandridge Ln Unit 103
- 3955 Faircross Place Unit 60
- 3803 Billman St
- 3930 60th St Unit 171
- 3934 60th St Unit 158
- 3489 Glade St
- 4259 View Place
- 3980 Faircross Place Unit 11
- 3980 Faircross Place Unit 32
- 6143 Tarragona Dr
- 4281 College Ave
- 6310 Thorn St
- 6283 Lorca Dr
- 4352 Athens St