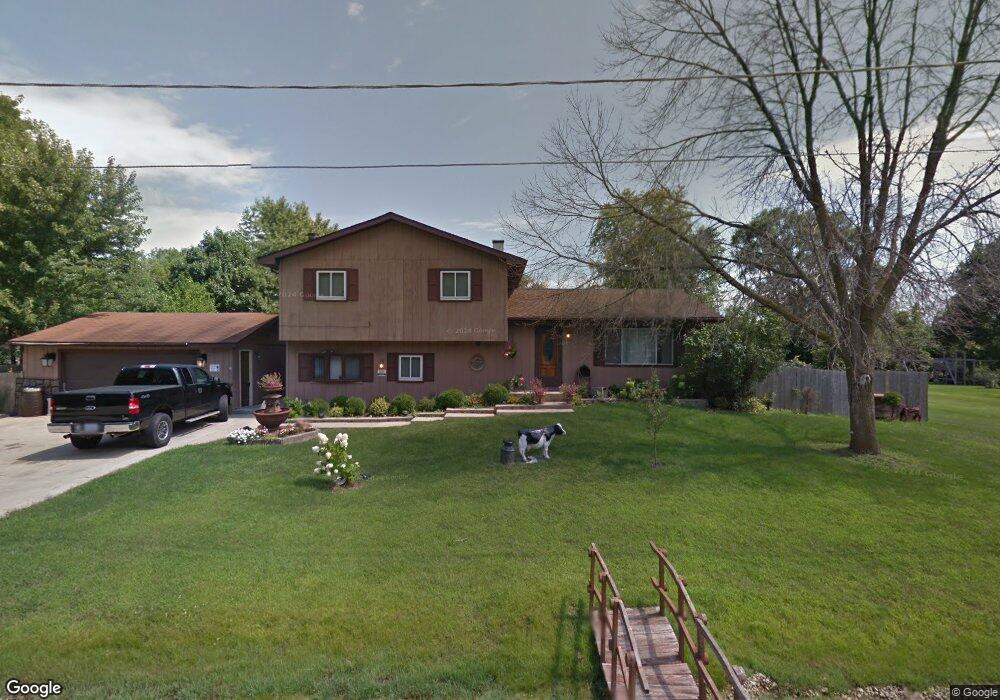
38585 N Pine Grove Ave Wadsworth, IL 60083
Estimated Value: $295,856 - $358,000
3
Beds
2
Baths
1,252
Sq Ft
$270/Sq Ft
Est. Value
About This Home
This home is located at 38585 N Pine Grove Ave, Wadsworth, IL 60083 and is currently estimated at $337,464, approximately $269 per square foot. 38585 N Pine Grove Ave is a home located in Lake County with nearby schools including Spaulding Elementary School, Viking Middle School, and Warren Township High School.
Ownership History
Date
Name
Owned For
Owner Type
Purchase Details
Closed on
Oct 21, 2024
Sold by
Arizmendi Graciela
Bought by
Arizmendi Junenelly
Current Estimated Value
Purchase Details
Closed on
Apr 11, 2007
Sold by
Golowski Brian J and Golowski Anne M
Bought by
Arizmendi Graciela
Home Financials for this Owner
Home Financials are based on the most recent Mortgage that was taken out on this home.
Original Mortgage
$250,000
Interest Rate
8.02%
Mortgage Type
Purchase Money Mortgage
Purchase Details
Closed on
May 18, 1998
Sold by
Szostak Steven and Szostak Dawn M
Bought by
Golowski Brian J and Golowski Anne M
Home Financials for this Owner
Home Financials are based on the most recent Mortgage that was taken out on this home.
Original Mortgage
$140,400
Interest Rate
7.15%
Create a Home Valuation Report for This Property
The Home Valuation Report is an in-depth analysis detailing your home's value as well as a comparison with similar homes in the area
Home Values in the Area
Average Home Value in this Area
Purchase History
| Date | Buyer | Sale Price | Title Company |
|---|---|---|---|
| Arizmendi Junenelly | -- | None Listed On Document | |
| Arizmendi Graciela | $250,000 | First American Title | |
| Golowski Brian J | $156,000 | -- |
Source: Public Records
Mortgage History
| Date | Status | Borrower | Loan Amount |
|---|---|---|---|
| Previous Owner | Arizmendi Graciela | $250,000 | |
| Previous Owner | Golowski Brian J | $140,400 |
Source: Public Records
Tax History Compared to Growth
Tax History
| Year | Tax Paid | Tax Assessment Tax Assessment Total Assessment is a certain percentage of the fair market value that is determined by local assessors to be the total taxable value of land and additions on the property. | Land | Improvement |
|---|---|---|---|---|
| 2024 | $6,936 | $77,510 | $11,888 | $65,622 |
| 2023 | $6,790 | $70,423 | $10,371 | $60,052 |
| 2022 | $6,790 | $69,501 | $9,468 | $60,033 |
| 2021 | $5,866 | $63,234 | $8,628 | $54,606 |
| 2020 | $5,705 | $61,764 | $8,427 | $53,337 |
| 2019 | $5,531 | $59,315 | $8,093 | $51,222 |
| 2018 | $4,958 | $55,991 | $7,792 | $48,199 |
| 2017 | $4,642 | $54,952 | $7,647 | $47,305 |
| 2016 | $4,554 | $53,114 | $7,391 | $45,723 |
| 2015 | $4,392 | $50,160 | $6,980 | $43,180 |
| 2014 | $4,068 | $48,785 | $6,789 | $41,996 |
| 2012 | $4,205 | $49,598 | $6,902 | $42,696 |
Source: Public Records
Map
Nearby Homes
- 38603 N Pine Grove Ave
- 13076 W Pickford St
- 12920 W Wadsworth Rd
- 39111 N Aberdeen Ln Unit 39111
- 39124 Welsh Ln Unit 5521
- 39092 Welsh Ln Unit 5501
- 12582 W Beach Rd
- 38859 N Green Bay Rd
- 12640 W Wadsworth Rd
- 13155 W Yorkshire Ln
- 39113 N Green Bay Rd
- 39616 N Warren Ln Unit 4824
- 39631 N Warren Ln Unit 4625
- 38715 N Red Oak Terrace
- 38148 N Helena Ln
- 4150 Midlane Dr
- 39694 N Warren Ln Unit 4763
- 39401 N Green Bay Rd
- 4171 Midlane Dr
- 39520 N Green Bay Rd
- 38567 N Pine Grove Ave
- 38586 N Pine Grove Ave
- 38604 N Pine Grove Ave
- 38568 N Pine Grove Ave
- 38539 N Pine Grove Ave
- 38540 N Pine Grove Ave
- 38585 N Magnolia Ave
- 13235 W Hart St
- 38603 N Magnolia Ave
- 38567 N Magnolia Ave
- 38661 N Pine Grove Ave
- 38539 N Magnolia Ave
- 38660 N Pine Grove Ave
- 38513 N Magnolia Ave
- 38661 N Magnolia Ave
- 13226 W Hart St
- 13205 W Hart St
- 38604 N Magnolia Ave
- 38568 N Magnolia Ave
- 38679 N Pine Grove Ave